Free Access
Fig. 6.
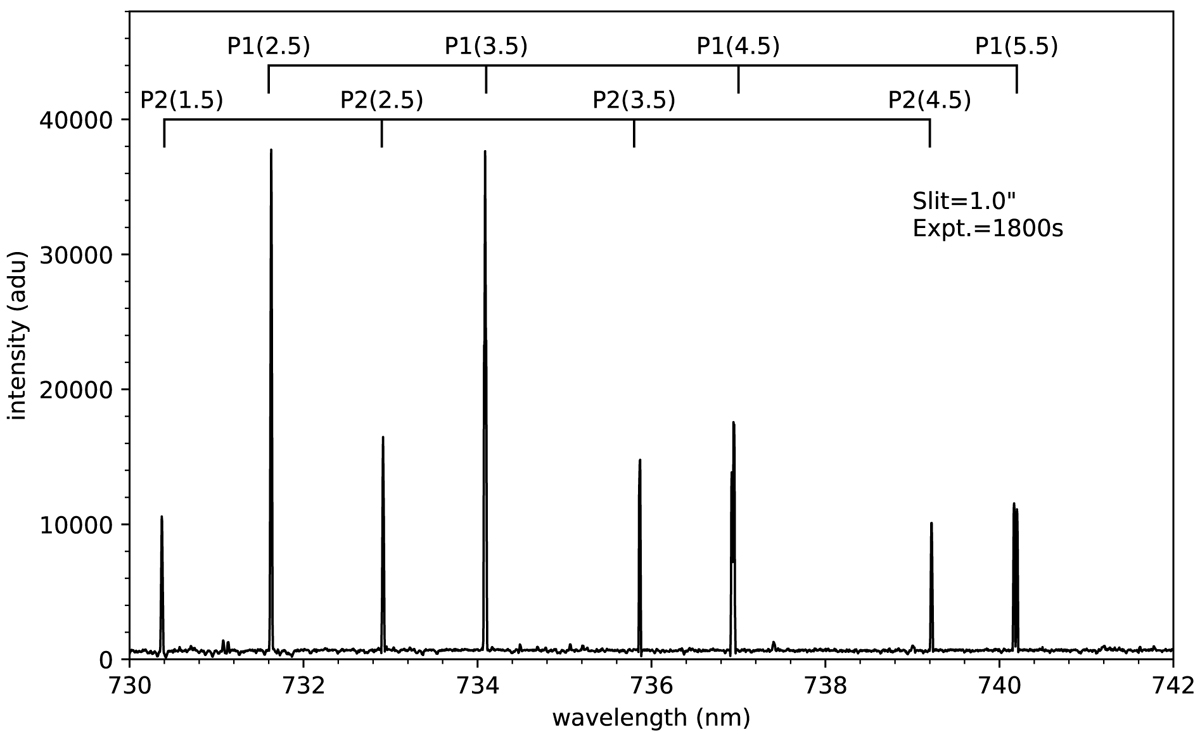
OH(8-3) band from UVES Phase 3 data sample with a slit 1.0 and exposure time 1800 s measured on March 19, 2008. Intensity without flux-calibrated is given in adu. The P1 branch lines used in this work are also labeled.
Current usage metrics show cumulative count of Article Views (full-text article views including HTML views, PDF and ePub downloads, according to the available data) and Abstracts Views on Vision4Press platform.
Data correspond to usage on the plateform after 2015. The current usage metrics is available 48-96 hours after online publication and is updated daily on week days.
Initial download of the metrics may take a while.