Fig. 2.
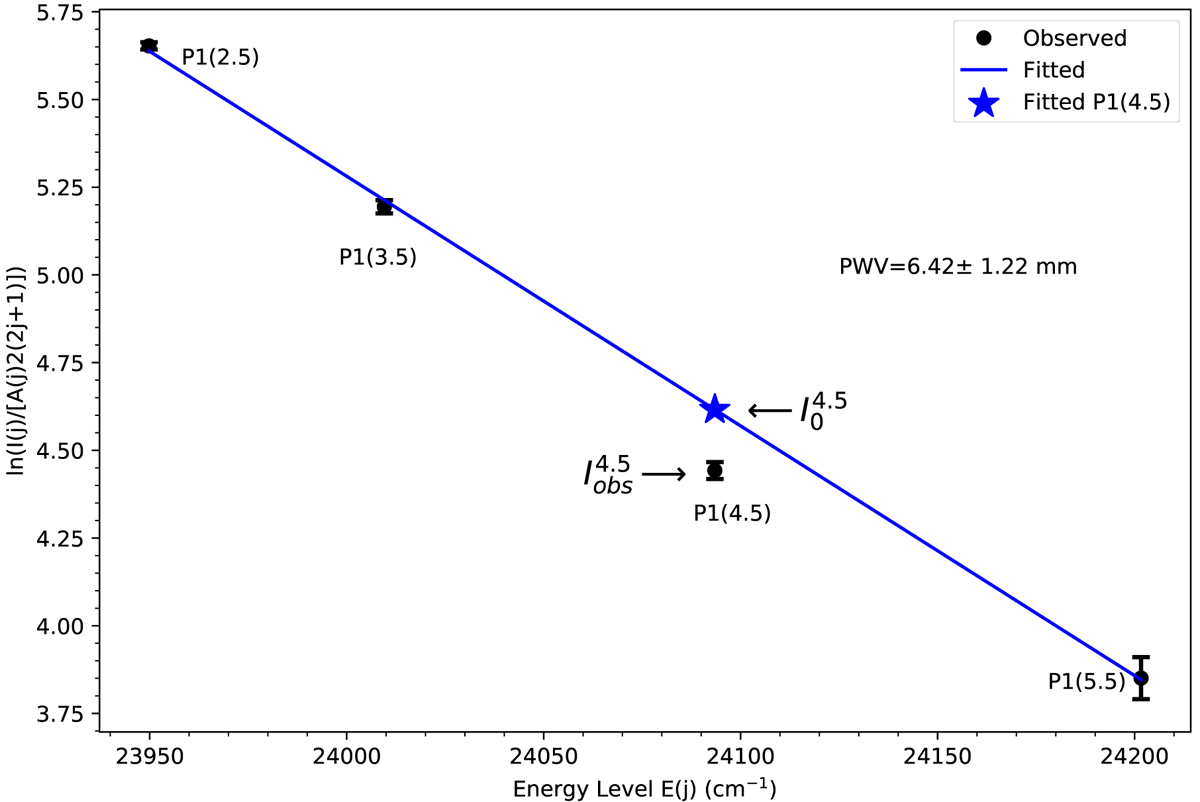
Observation of UVES on March 19, 2008 example. The linear line is fitted using P1(2.5), P1(3.5), and P1(5.5) line intensities in the OH(8-3) band. The P1(4.5) emission line without absorption by water vapor is indicated with an asterisk. The error bars are the uncertainties of intensities, which are estimated by the S/N given in the UVES dataset.
Current usage metrics show cumulative count of Article Views (full-text article views including HTML views, PDF and ePub downloads, according to the available data) and Abstracts Views on Vision4Press platform.
Data correspond to usage on the plateform after 2015. The current usage metrics is available 48-96 hours after online publication and is updated daily on week days.
Initial download of the metrics may take a while.