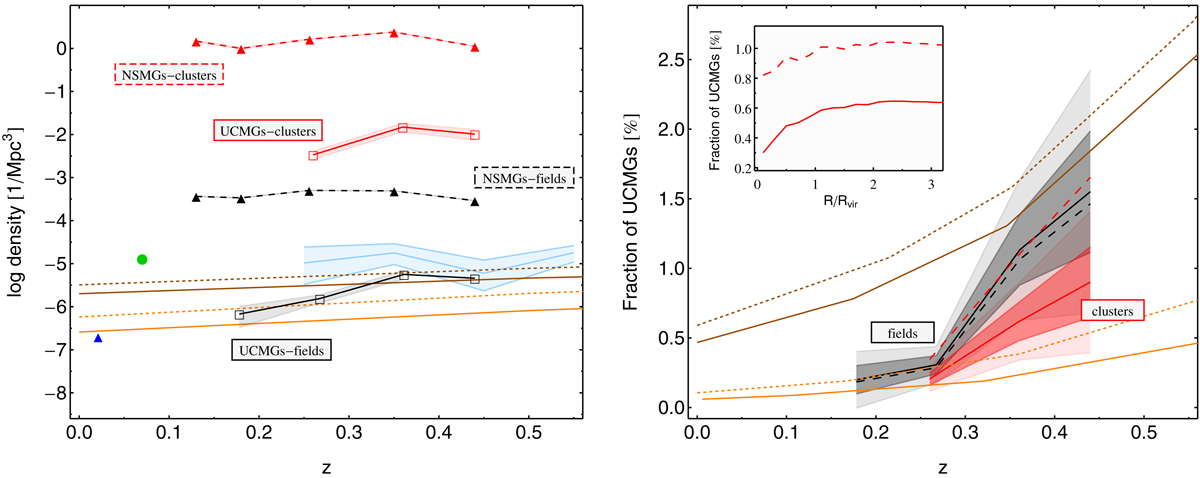
Fig. 1.
Left panel: number density of UCMGS (solid line, squared points) and NSMGS (dashed lines, triangles) as a function of redshift and environment (black lines for field and red for cluster galaxies). Shaded regions correspond to 1σ errors, accounting for Poisson noise, cosmic variance, and uncertainties in size and mass selection, but neglecting the nominal uncertainties on the photometric redshifts (S20). The cyan line refers to number densities for UCMGS in the COSMOS area by Damjanov et al. (2015b). The green point and blue triangle are the results for compact galaxies from Poggianti et al. (2013a) and Ferré-Mateu et al. (2017), respectively. Orange and brown curves are extracted from Quilis & Trujillo (2013): dashed and solid lines refer to Guo et al. (2011, 2013) SAMs, respectively, while orange (brown) lines are for galaxies that have increased their mass by less than 10 (30)%. No selection in environment is performed in such simulations. Right panel: fraction of UCMGS, calculated with respect to the total parent population in fields (black) and clusters (red), as a function of redshift. Dark (light) shaded regions show 1σ (2σ) errors in each redshift bin. Dashed black and red lines are for UCMGS with log M⋆/M⊙ ≤ 11.2 dex in field and clusters, respectively. The Guo et al. (2011, 2013) results are also plotted. Inset: fraction of UCMGS in clusters as a function of the distance R from the center in units of Rvir. The dashed line is for UCMGS with log M⋆/M⊙ ≤ 11.2 dex.
Current usage metrics show cumulative count of Article Views (full-text article views including HTML views, PDF and ePub downloads, according to the available data) and Abstracts Views on Vision4Press platform.
Data correspond to usage on the plateform after 2015. The current usage metrics is available 48-96 hours after online publication and is updated daily on week days.
Initial download of the metrics may take a while.