Fig. 8
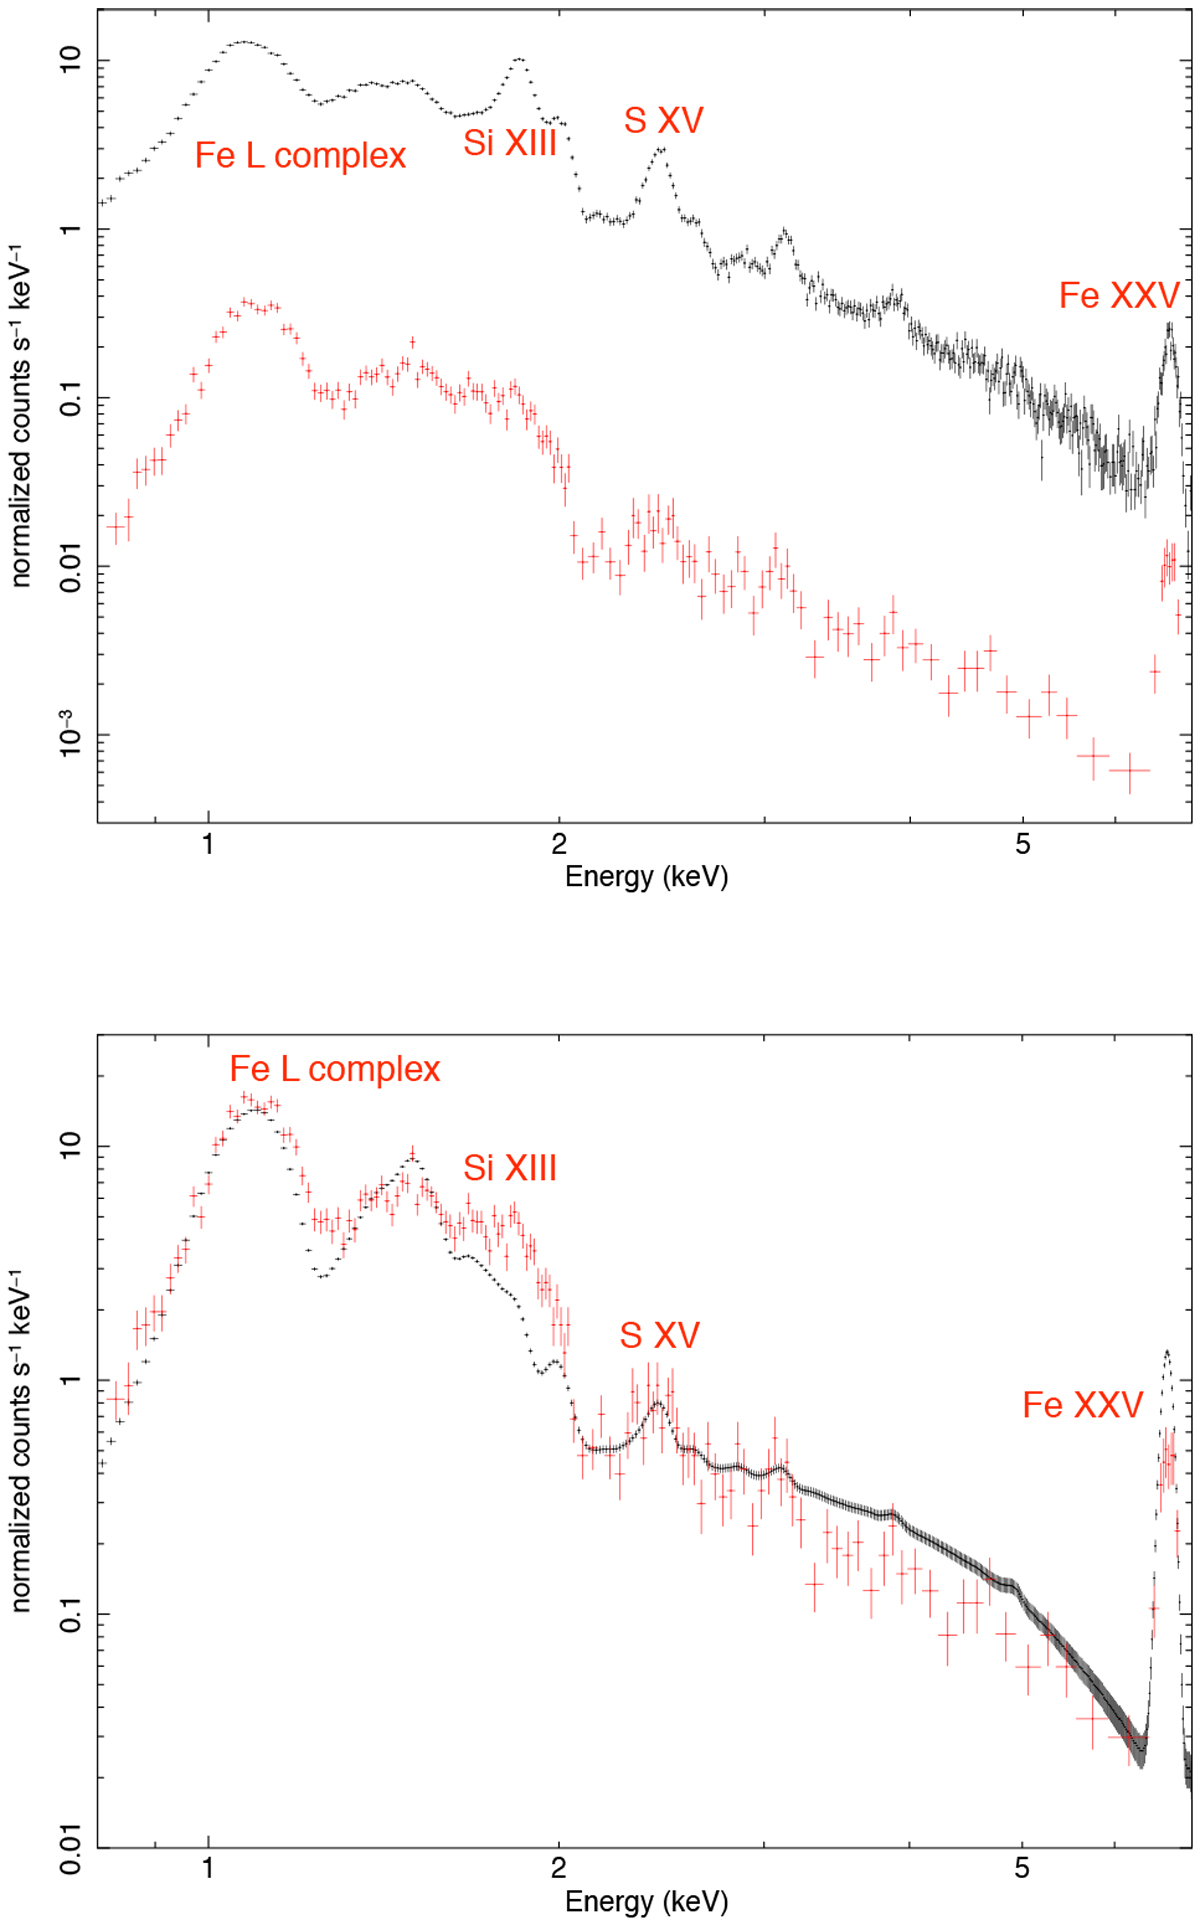
Comparison between actual Chandra spectra. Upper panel: Chandra ACIS-S spectra extracted from the southeasternFe-rich clump (black box in Fig. 7) and from the Fe-rich cloudlet (red box in Fig. 7) shown by black and red crosses, respectively. Lower panel: Chandra ACIS-S synthetic spectrum clump derived from the HD simulation of the southeastern Fe-rich (black crosses). Red crosses show the renormalized observed spectrum of the Fe-rich cloudlet shown in the upper panel for easy comparison with the synthetic spectrum.
Current usage metrics show cumulative count of Article Views (full-text article views including HTML views, PDF and ePub downloads, according to the available data) and Abstracts Views on Vision4Press platform.
Data correspond to usage on the plateform after 2015. The current usage metrics is available 48-96 hours after online publication and is updated daily on week days.
Initial download of the metrics may take a while.