Free Access
Fig. A.1
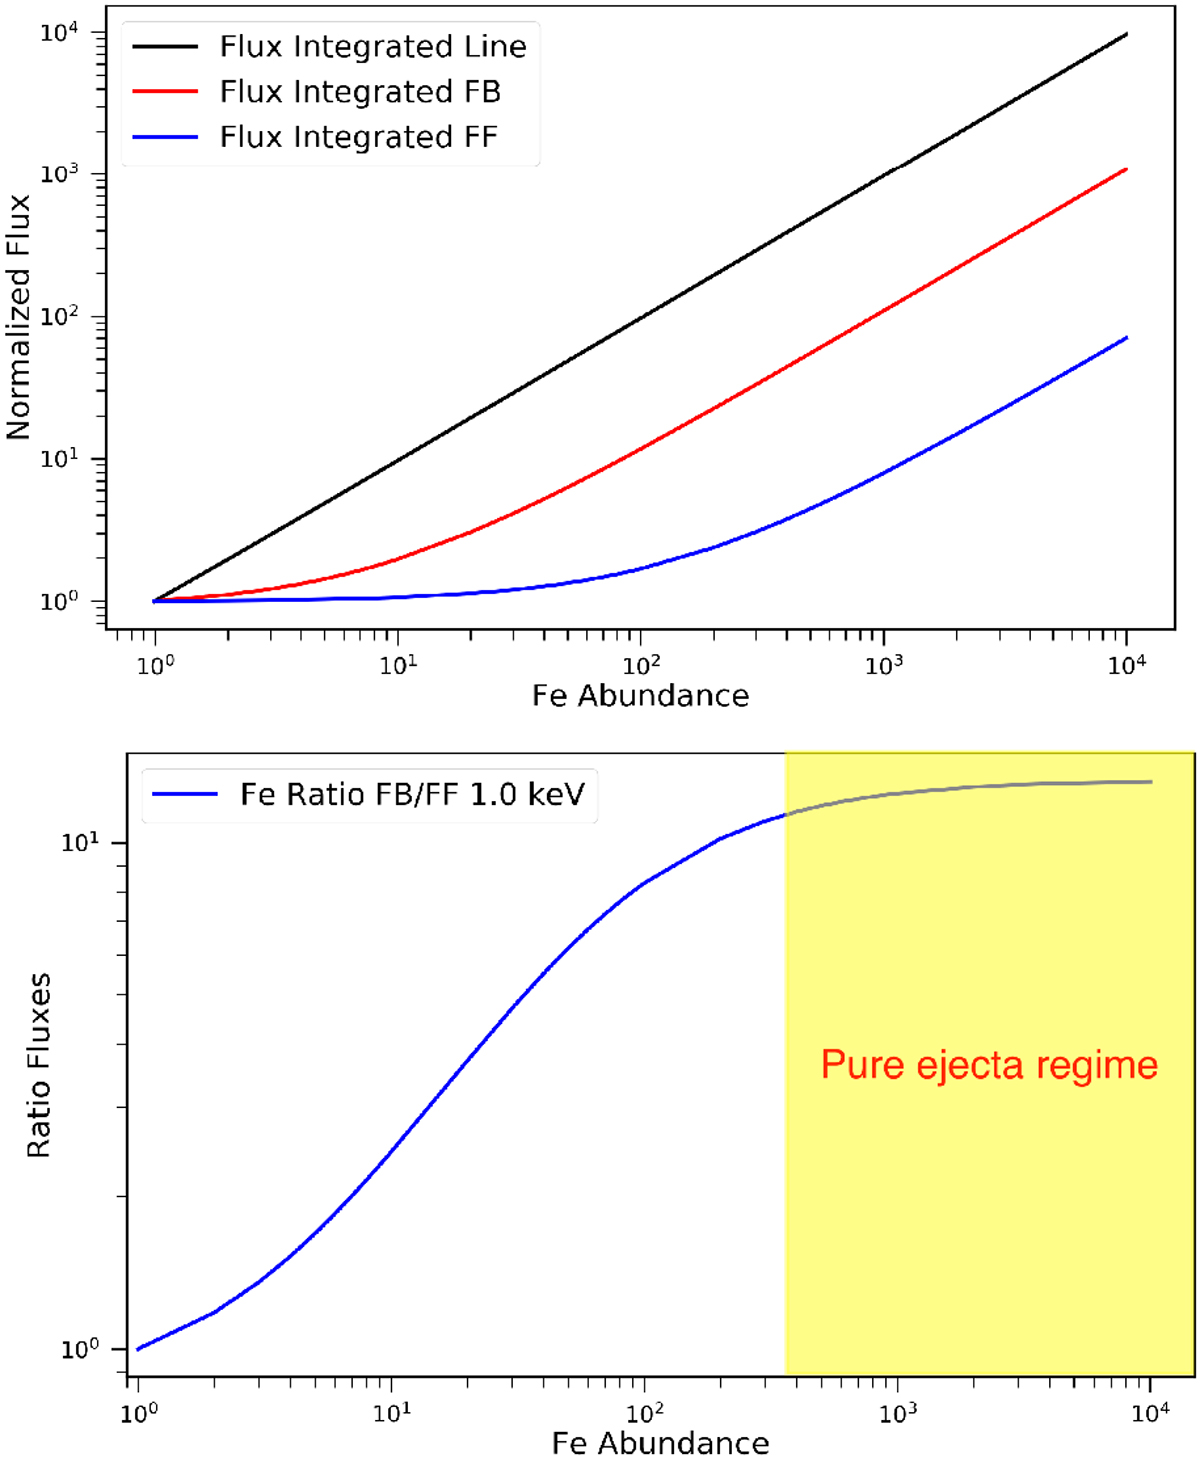
X-ray fluxes of different emission processes in the corresponding energy bands (see Table 2) as a function of Fe abundance. Upper panel: same as Fig. 1 with Fe instead of Si. Lower panel: ratio between the FF and FB fluxes shown in the upper panel as a function of Fe abundance for a plasma temperature of 1 keV.
Current usage metrics show cumulative count of Article Views (full-text article views including HTML views, PDF and ePub downloads, according to the available data) and Abstracts Views on Vision4Press platform.
Data correspond to usage on the plateform after 2015. The current usage metrics is available 48-96 hours after online publication and is updated daily on week days.
Initial download of the metrics may take a while.