Free Access
Fig. 7.
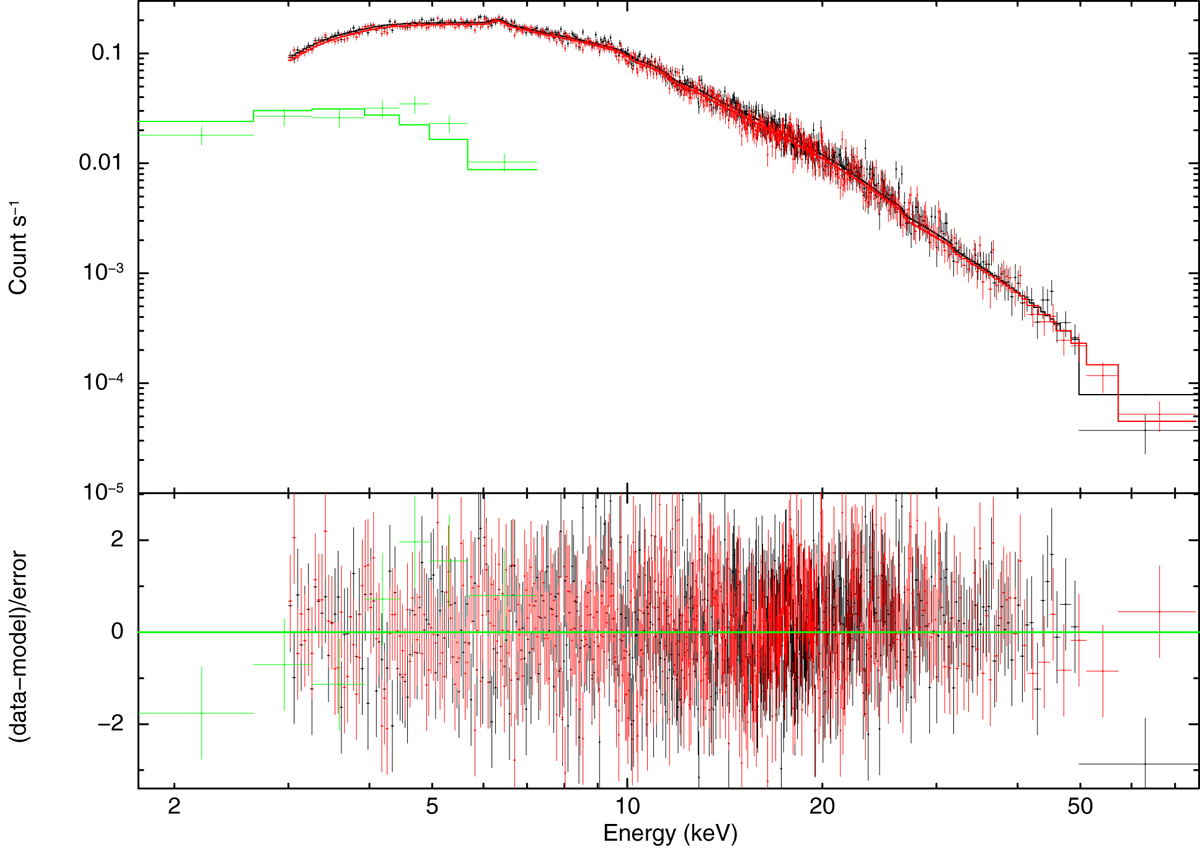
Swift/XRT and NuSTAR time-averaged spectra, fitted with an absorbed power law modified by a high-energy cutoff, together with a Gaussian line in emission, accounting for iron line at ∼6.4 keV (see Table 2, model PLCUT, for the best fit parameters). Lower panel: residuals are shown in terms of standard deviation.
Current usage metrics show cumulative count of Article Views (full-text article views including HTML views, PDF and ePub downloads, according to the available data) and Abstracts Views on Vision4Press platform.
Data correspond to usage on the plateform after 2015. The current usage metrics is available 48-96 hours after online publication and is updated daily on week days.
Initial download of the metrics may take a while.