Free Access
Fig. 5.
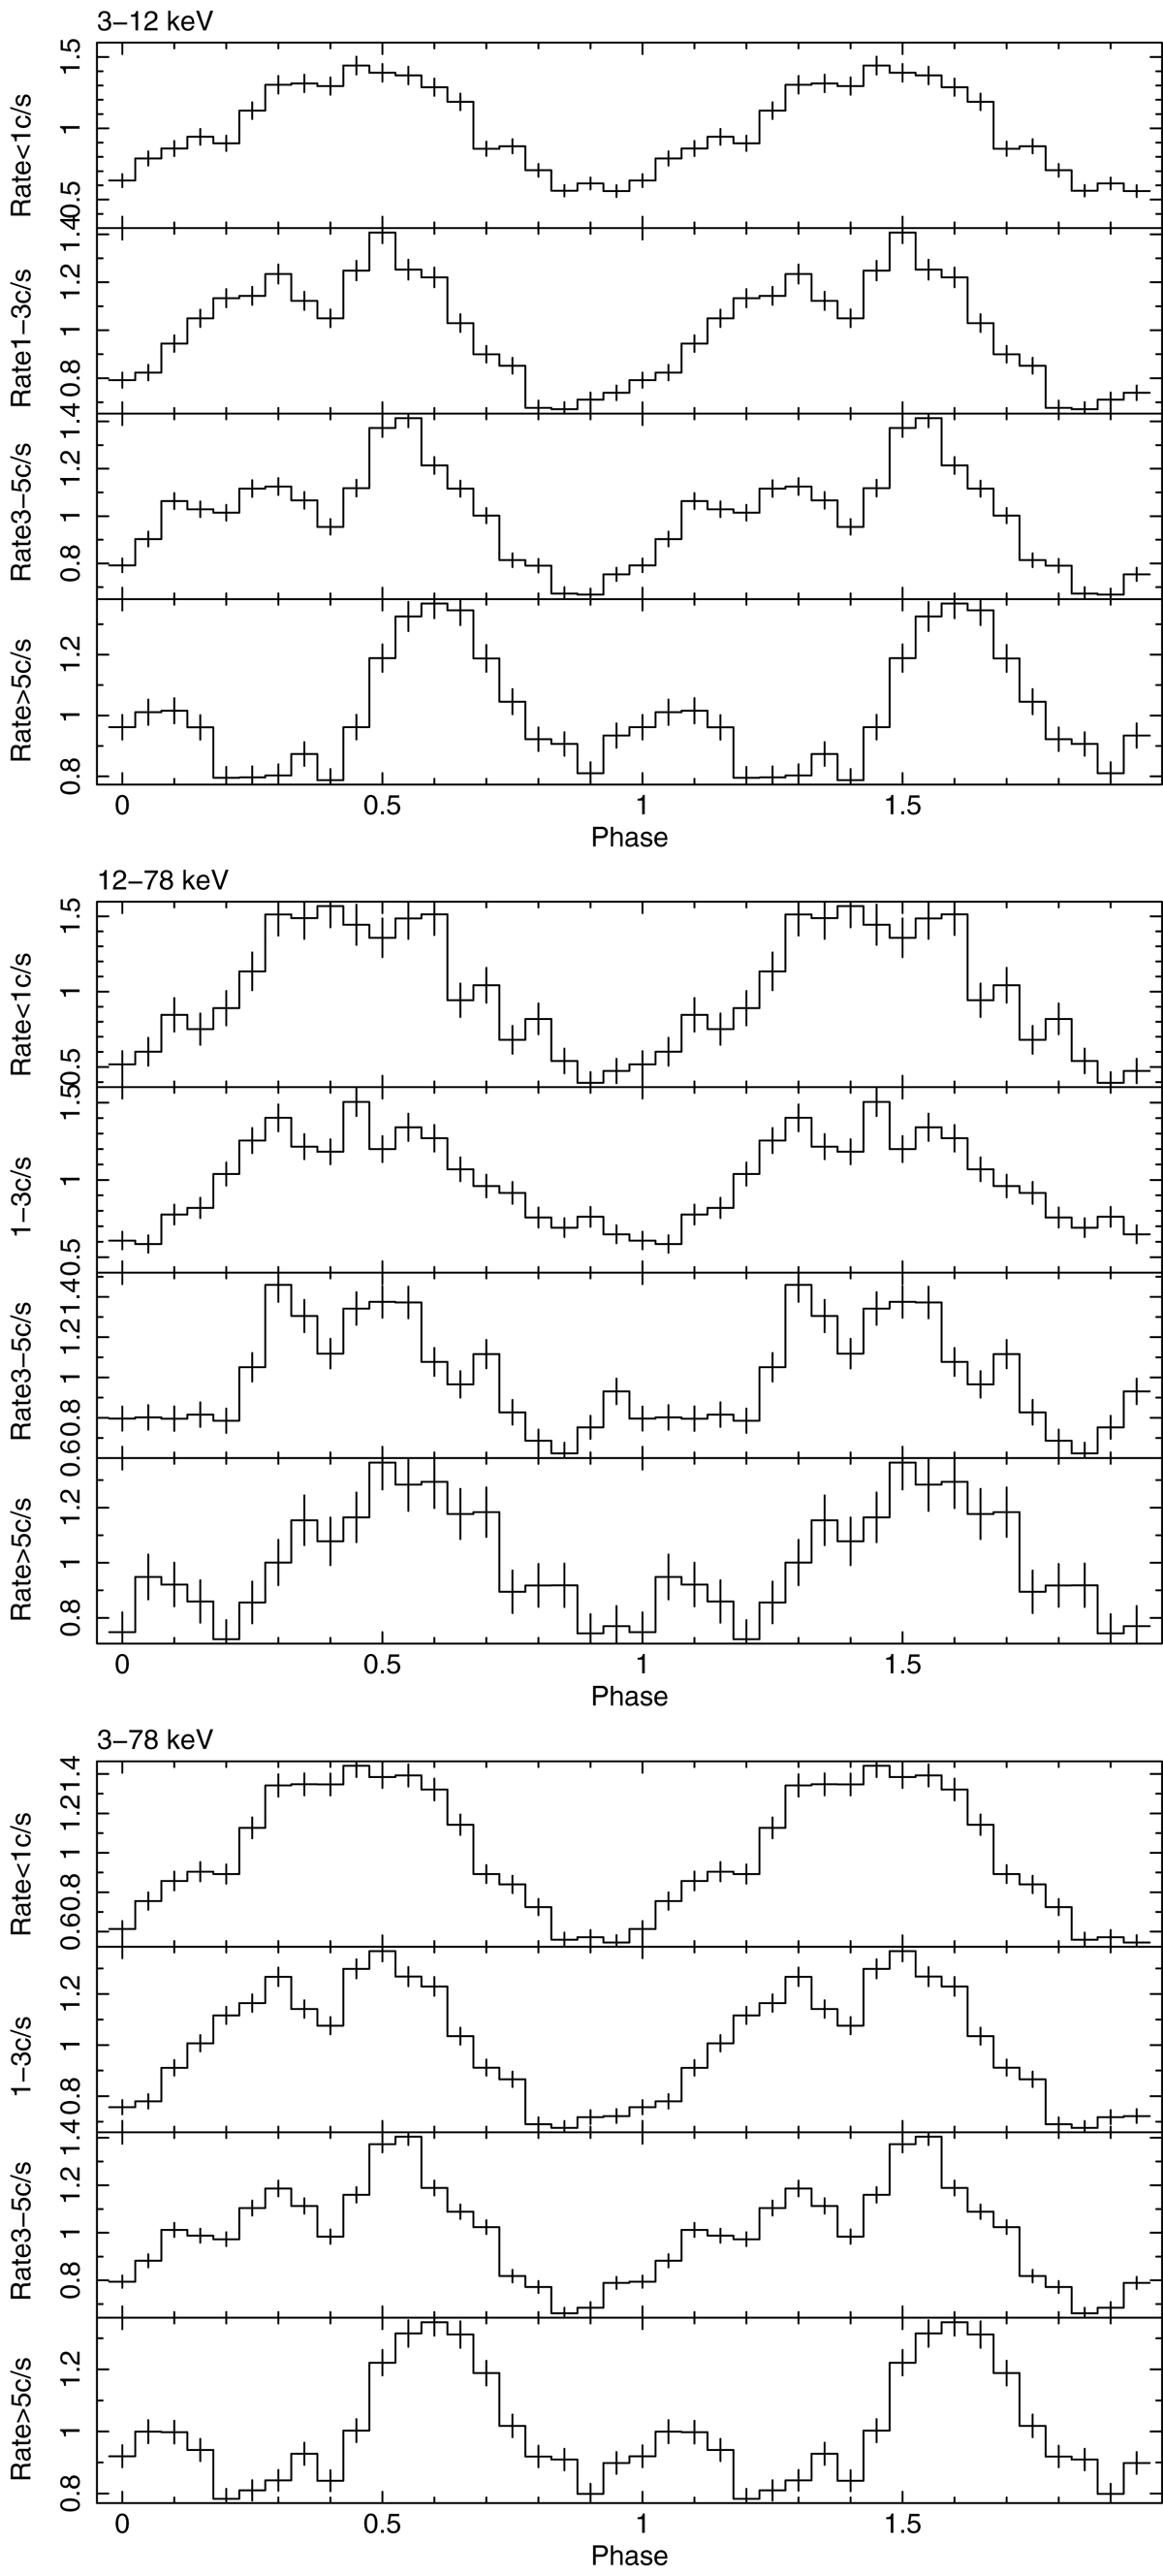
IGR J11215−5952 pulse profiles in three energy bands (from top to bottom, 3−12 keV, 12−78 keV and 3−78 keV). For each energy band, we report pulse profiles in four intensity-selected intervals. Each profile has been normalised by dividing by the average source intensity in the considered energy band.
Current usage metrics show cumulative count of Article Views (full-text article views including HTML views, PDF and ePub downloads, according to the available data) and Abstracts Views on Vision4Press platform.
Data correspond to usage on the plateform after 2015. The current usage metrics is available 48-96 hours after online publication and is updated daily on week days.
Initial download of the metrics may take a while.