Fig. 3.
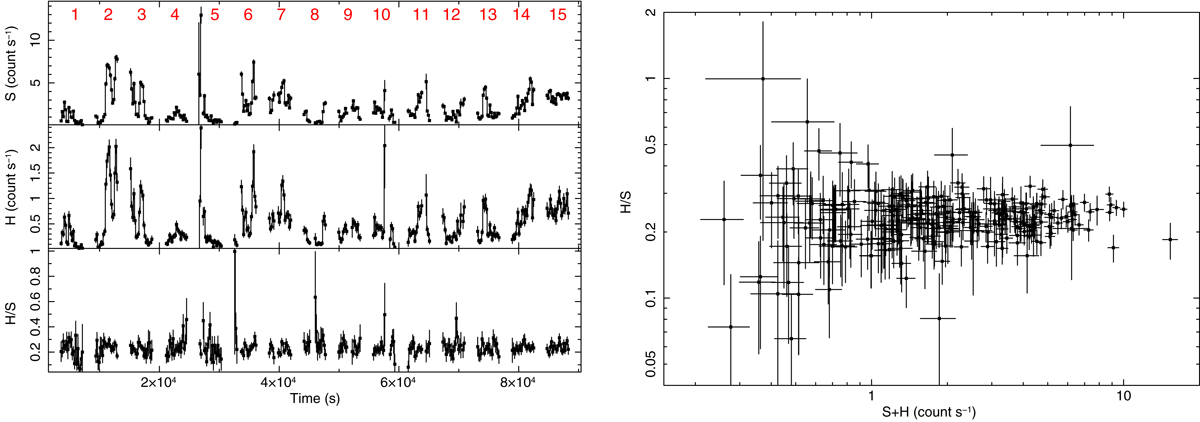
IGR J11215−5952 light curves in two energy bands (S = 3–12 keV, H = 12–78 keV) together with their hardness ratio (HR, on the left). Red numbers on the top of the soft X-ray’s light curve indicate the NuSTAR satellite revolutions analysed in Table 3. Right: same hardness ratio versus the 3–78 keV count rate is shown. In both panels, a bin time of 187 s has been adopted.
Current usage metrics show cumulative count of Article Views (full-text article views including HTML views, PDF and ePub downloads, according to the available data) and Abstracts Views on Vision4Press platform.
Data correspond to usage on the plateform after 2015. The current usage metrics is available 48-96 hours after online publication and is updated daily on week days.
Initial download of the metrics may take a while.