Fig. 1.
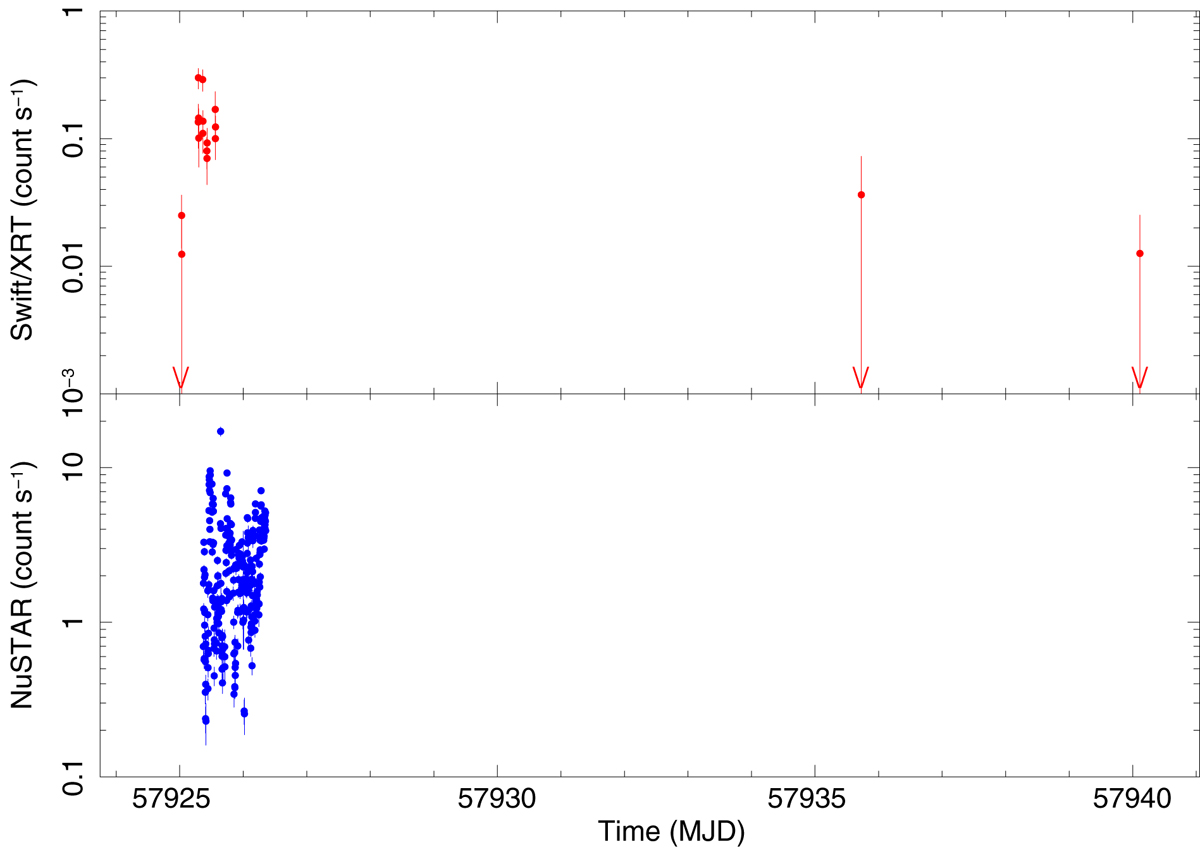
Swift/XRT (0.3−10 keV) light curve of IGR J11215−5952 to monitor the onset of the 2017 outburst (upper panel), compared with the times of the NuSTAR observation (lower panel, 3−78 keV). A time binning of 187 s has been assumed. We note that, since there are gaps in both observations (by Swift and NuSTAR), unfortunately they were never simultaneous. The down arrows in the upper panel indicate upper limits.
Current usage metrics show cumulative count of Article Views (full-text article views including HTML views, PDF and ePub downloads, according to the available data) and Abstracts Views on Vision4Press platform.
Data correspond to usage on the plateform after 2015. The current usage metrics is available 48-96 hours after online publication and is updated daily on week days.
Initial download of the metrics may take a while.