Open Access
Fig. 14.
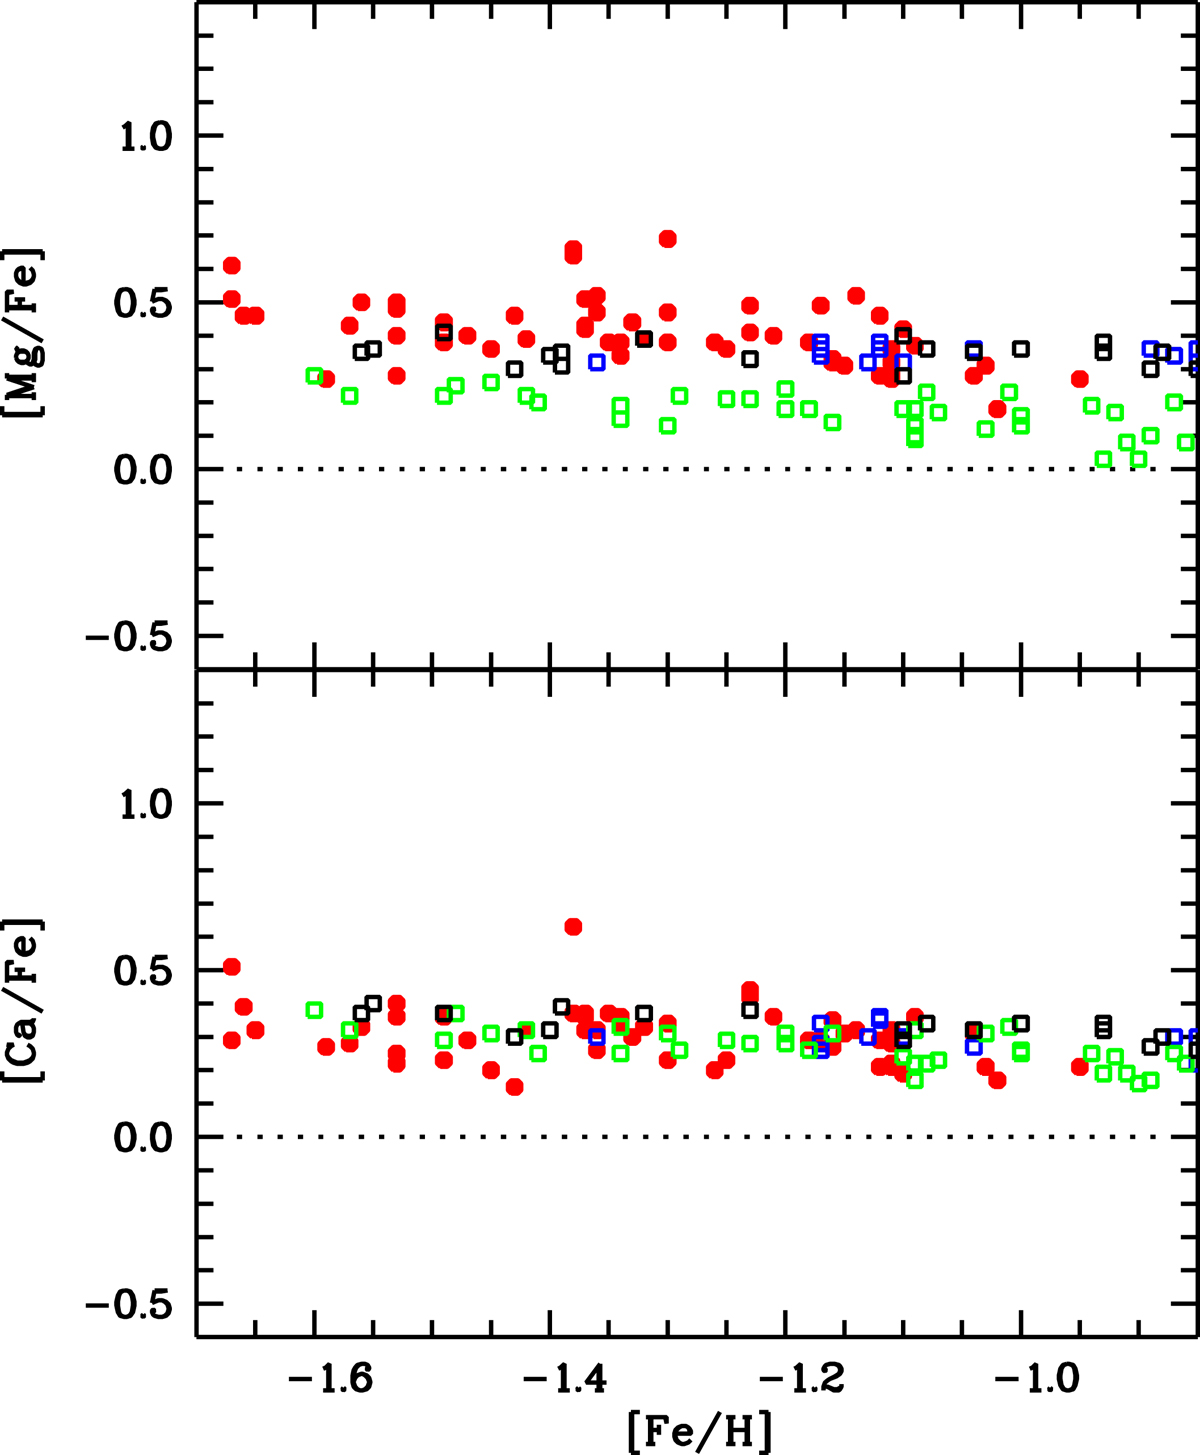
Abundances of α-elements vs. [Fe/H]: solid red symbols are the stars here analysed, compared with the data by Nissen & Schuster (2010) as open squares, green the low-α, black the high-α and blue thick-disc stars.
Current usage metrics show cumulative count of Article Views (full-text article views including HTML views, PDF and ePub downloads, according to the available data) and Abstracts Views on Vision4Press platform.
Data correspond to usage on the plateform after 2015. The current usage metrics is available 48-96 hours after online publication and is updated daily on week days.
Initial download of the metrics may take a while.