Fig. 9.
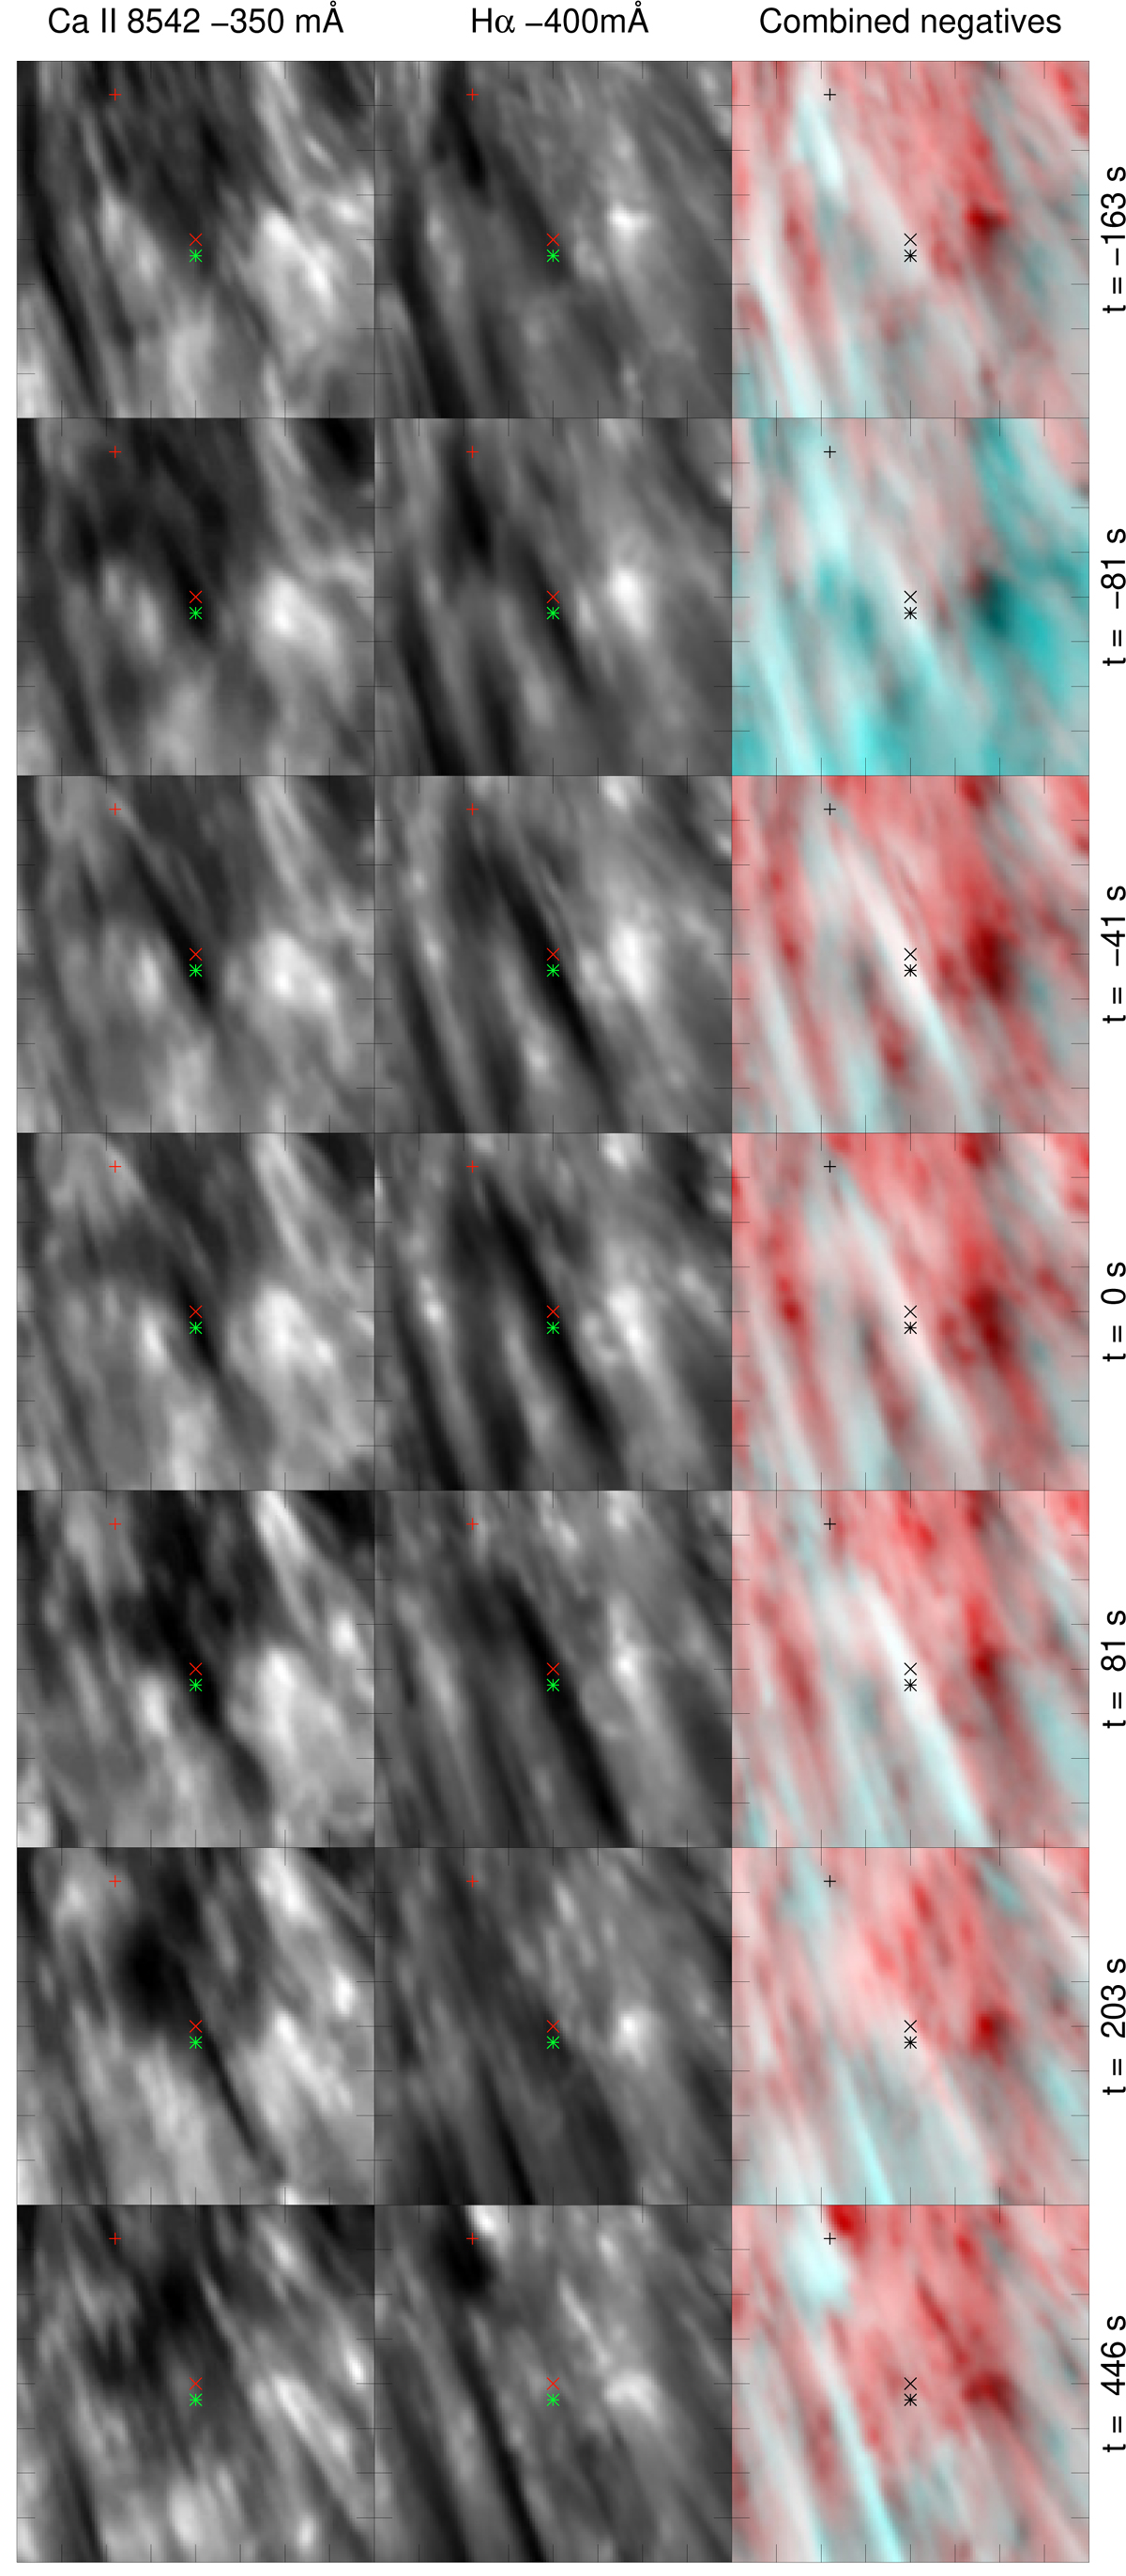
PMJ A10 and associated dark features in CRISP images in the Ca II 8542 Å line at offset −350 mÅ (left column), the H α line at an offset of −400 mÅ (middle column), and a value-inverted combination of these (right column), which is shown at indicated time offsets (time increasing top to bottom). Tick-marks are spaced 1″apart. Time t = 0 s is when the PMJ achieves maximum brightness at Ca II 8542 Å −350 mÅ (marked with a plus sign). The combined image displays (re-scaled) negatives of the two CRISP images at their respective offsets, with bright red indicating dark Ca II 8542 Å −350 mÅ features and bright cyan indicating dark H α −400 mÅ features, when dark features overlap in the two channels, they combine to white in the combined image. Sample positions used for sampling profiles are indicated as follows: plus sign, Ca II 8542 Å line (bright feature); cross, Ca II 8542 Å line (dark feature); and asterisk, H α line (dark feature).
Current usage metrics show cumulative count of Article Views (full-text article views including HTML views, PDF and ePub downloads, according to the available data) and Abstracts Views on Vision4Press platform.
Data correspond to usage on the plateform after 2015. The current usage metrics is available 48-96 hours after online publication and is updated daily on week days.
Initial download of the metrics may take a while.