Fig. 8.
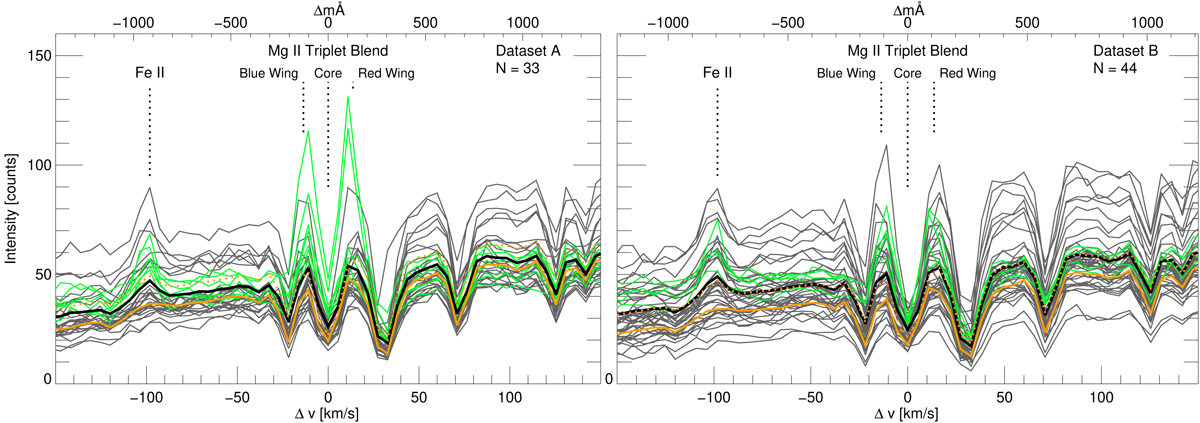
PMJ profiles in the wavelength region between the Mg II h & k lines for datasets A (left) and B (right). All PMJ profiles that were sampled at sampling positions given in Fig. 2 and 3 are shown (marked with green diamond symbols), coinciding with the Mg II h & k sampling positions. We show all individual profiles (grey solid line) together with those profiles that were identified to show emission in the triplet blend wings (green solid line). The mean profiles for all PMJ profiles (black solid line), the penumbra (yellow solid line), and the full field of view (yellow-dotted line) are also shown.
Current usage metrics show cumulative count of Article Views (full-text article views including HTML views, PDF and ePub downloads, according to the available data) and Abstracts Views on Vision4Press platform.
Data correspond to usage on the plateform after 2015. The current usage metrics is available 48-96 hours after online publication and is updated daily on week days.
Initial download of the metrics may take a while.