Fig. 6.
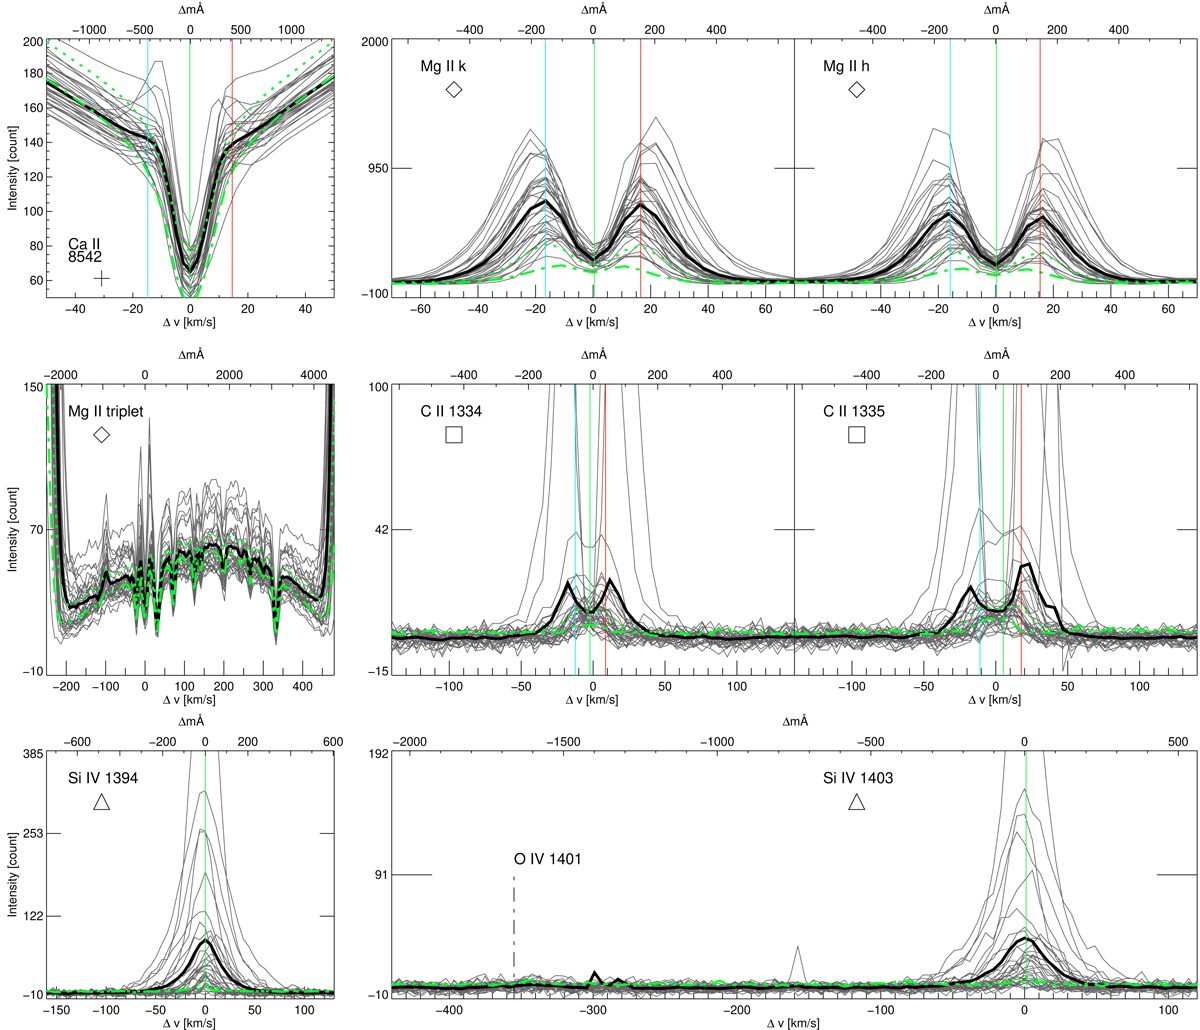
Spectral signatures of PMJs and reference average profiles in various spectral ranges from dataset A. The number of PMJ events is N = 33. Shown in panels left to right and top to bottom are profiles of the Ca II 8542 Å line, the Mg II k and h lines, the Mg II triplet, the C II 1334 Å and 1335 Å lines, and the Si IV 1394 Å and 1403 Å lines. Each panel is also labelled with the relevant profile name and the symbol that each spectral line is associated with when plotting the position from which the profile is sampled in other figures (see for instance Figs. 4 and 5). Furthermore, the spectral position of the O IV 1401 Å line in the panel of the Si IV 1403 Å line is also indicated by a vertical dash-dotted line. The different line styles in the panels, which are associated with the different spectral lines mentioned, indicate the different individual and average line profile and denote the following: grey solid lines, the line profiles of all individual PMJs detected in the observations; black solid line, the average profile of all detected PMJs; green-dotted line, the average line profile across all pixels in the observations; and green-dash-dotted line, the average line profile in the penumbra of AR12533. For all studied PMJ profiles, the mean positions of line core positions (vertical solid green lines) and those of red peaks (vertical solid red lines) or blue peaks (vertical solid blue lines) for those spectral lines where relevant are also marked in each panel.
Current usage metrics show cumulative count of Article Views (full-text article views including HTML views, PDF and ePub downloads, according to the available data) and Abstracts Views on Vision4Press platform.
Data correspond to usage on the plateform after 2015. The current usage metrics is available 48-96 hours after online publication and is updated daily on week days.
Initial download of the metrics may take a while.