Fig. 4.
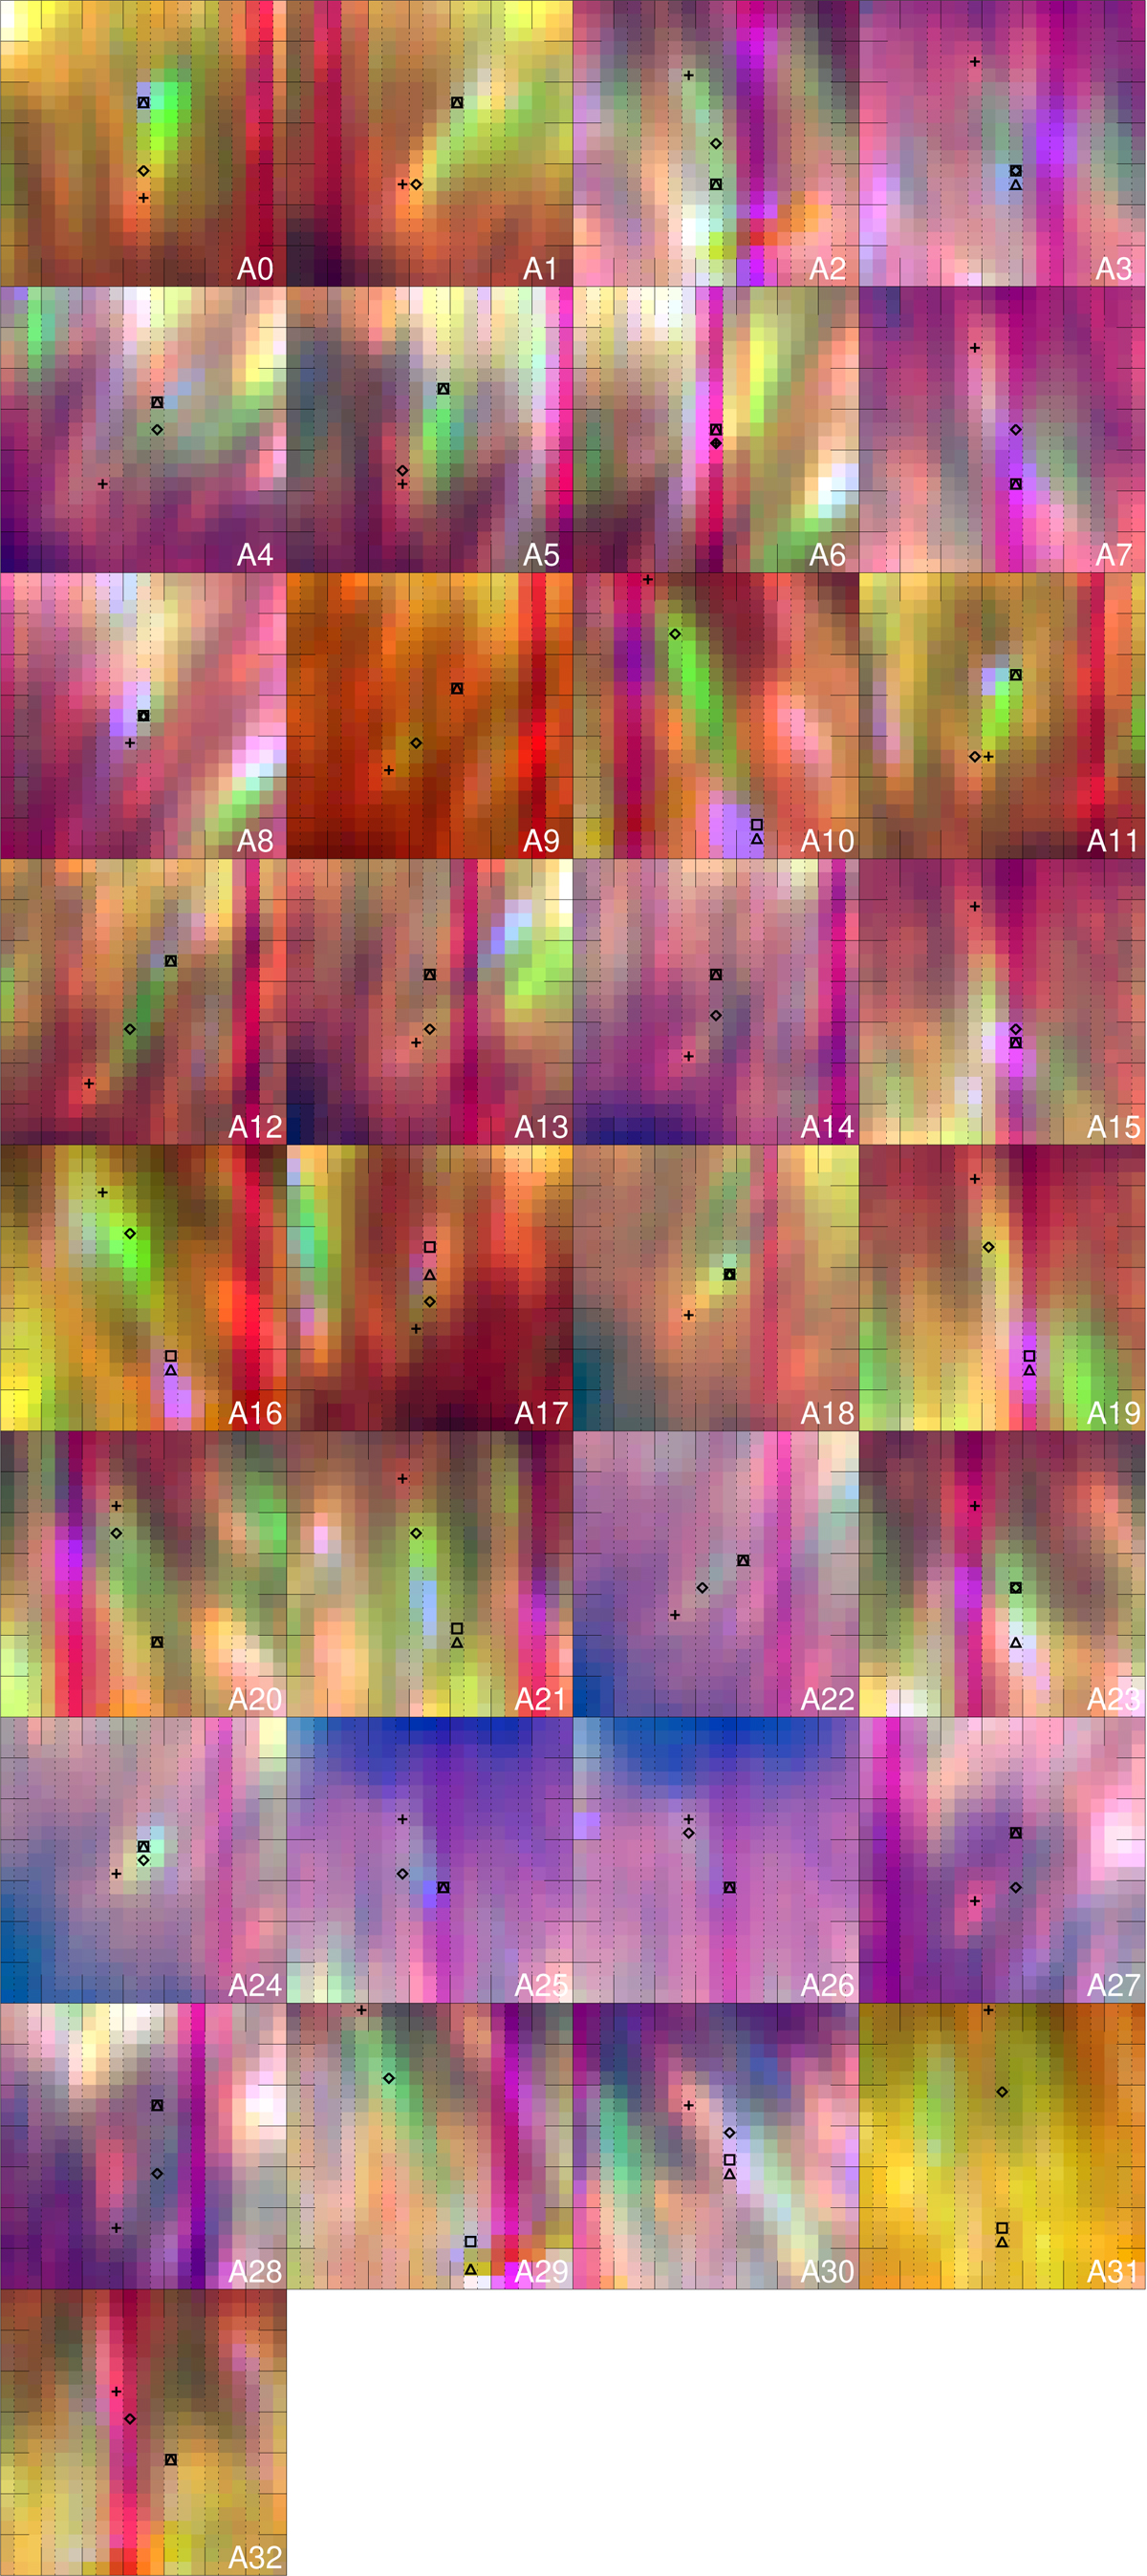
All PMJs from dataset A. Each panel highlights one PMJ at approximately peak intensity. The field of view for each panel is 7 arcseconds along the x- and y-axis and is centred on each PMJ displayed. The panels display colour composite images produced from Ca II 8542 Å at an offset of −350 mÅ and the IRIS SJI images in the Mg II and Si IV lines, which are coded to the colours red, green, and blue, respectively. Sampling positions for the analysis of the different spectral lines are indicated. Plus-sign: Ca II 8542 Å; diamond: the Mg II k, h, and triplet lines; square: C II 1334 Å and 1335 Å; and triangle: Si IV 1394 Å and 1403 Å. The raster-slit positions (of one-pixel width) of the IRIS slit-spectrograph are indicated and enclosed in each panel with black-dotted lines.
Current usage metrics show cumulative count of Article Views (full-text article views including HTML views, PDF and ePub downloads, according to the available data) and Abstracts Views on Vision4Press platform.
Data correspond to usage on the plateform after 2015. The current usage metrics is available 48-96 hours after online publication and is updated daily on week days.
Initial download of the metrics may take a while.