Fig. 2.
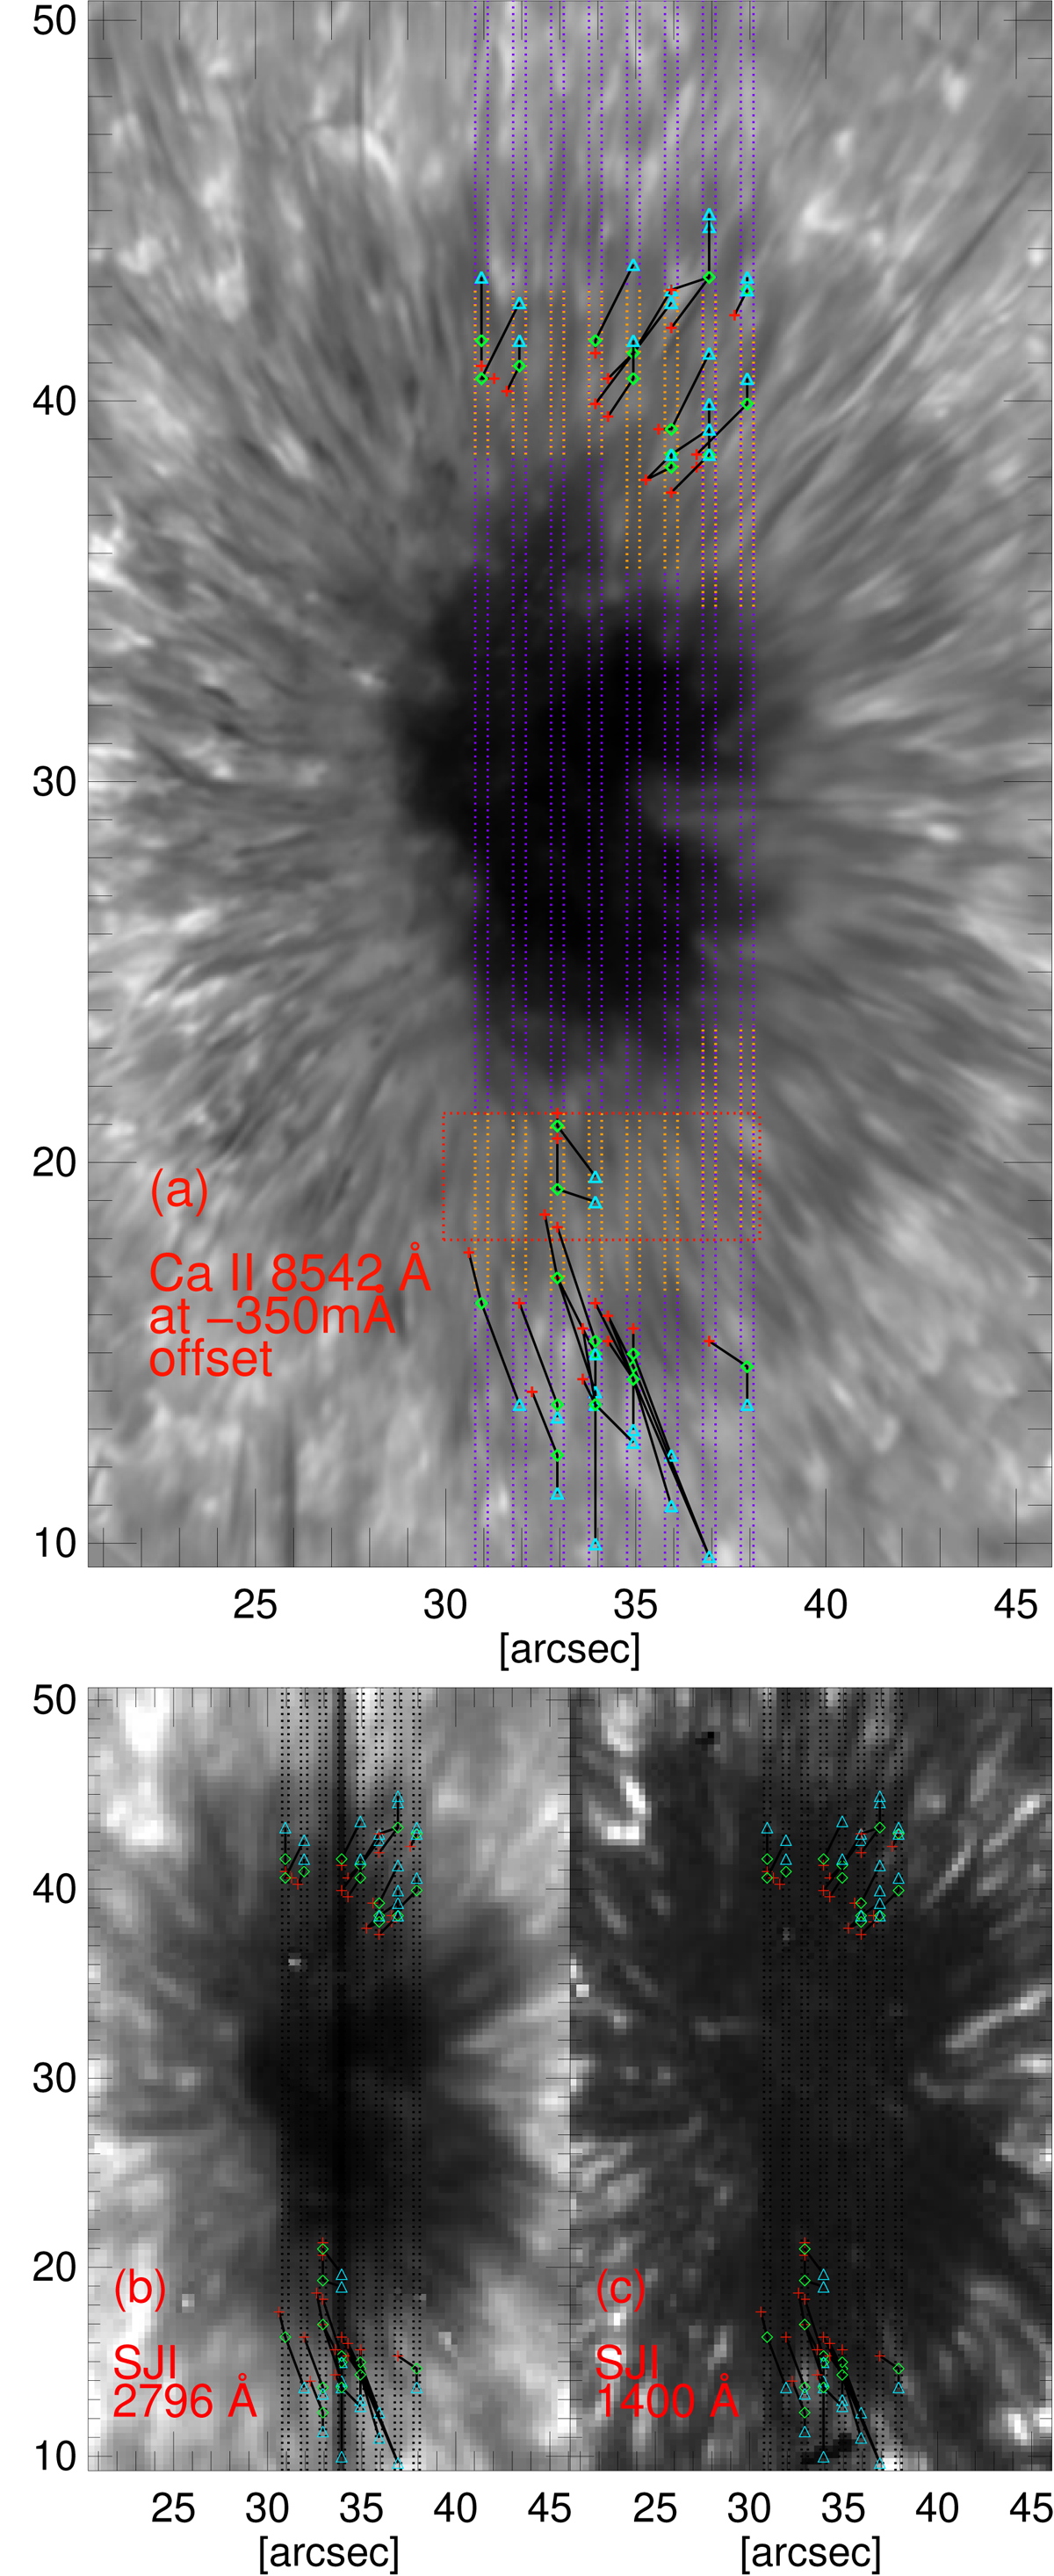
Cropped field of view of AR12533 on April 29, 2016 (dataset A), showing sampling positions for all PMJs studied on this date. Observations of (top) the SST Ca II 8542 Å line at an offset of −350 mÅ, (bottom left) the IRIS SJI Mg II k line image, and (bottom right) the IRIS SJI Si IV line image are shown. Symbols mark a subset of all the sampling positions for analysis of spectral line profiles. Red cross: Ca II 8542 Å; green diamond: the Mg II k, h, and triplet lines; and blue triangle: Si IV 1394 Å and 1403 Å lines. The raster-slit positions (of one-pixel width) of the IRIS slit-spectrograph are indicated and enclosed in each panel with purple-dashed lines. The mean spectral profiles for the penumbra in the IRIS lines were calculated in the yellow dash marked raster-slit areas. Penumbra mean spectral profiles in the CRISP lines were computed within the red dashed box.
Current usage metrics show cumulative count of Article Views (full-text article views including HTML views, PDF and ePub downloads, according to the available data) and Abstracts Views on Vision4Press platform.
Data correspond to usage on the plateform after 2015. The current usage metrics is available 48-96 hours after online publication and is updated daily on week days.
Initial download of the metrics may take a while.