Fig. B.1.
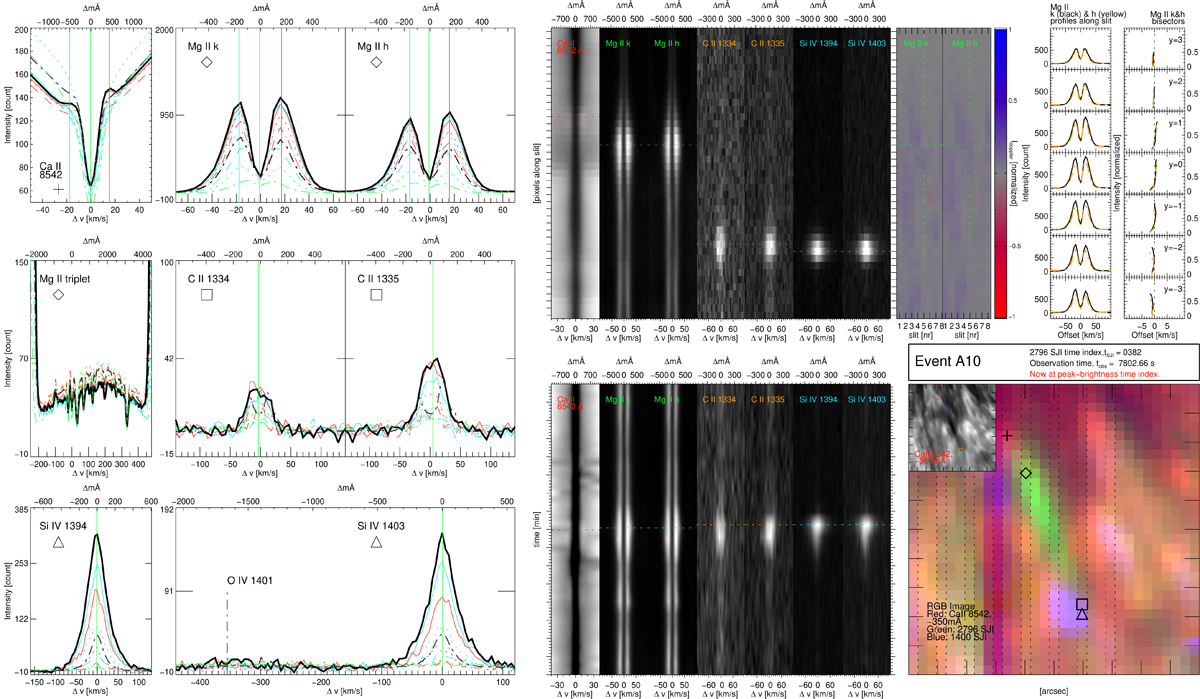
Peak-intensity time frame for PMJ A10 from the temporal evolution video for individual PMJs in dataset A. The layout is identical for datasets A and B. The spectral line profiles are shown on the left-hand side; panels from left to right and top to bottom show profiles for the Ca II 8542 Å line, the Mg II k and h lines, the Mg II triplet, the C II 1334 Å and 1335 Å lines, and the Si IV 1394 Å and 1403 Å lines (the latter has O IV 1401 Å indicated). The different linestyles denote the following: black solid line, the PMJ line profile at the sampling position; blue and red profiles were sampled at positive and negative vertical offsets from the main sampling position, respectively, with a different line style for each one-pixel difference; solid lines (one-pixel offset); dotted lines (two-pixel offset); dashed line (three-pixel offset); black-dashed line, the average PMJ line profile for the dataset; green-dotted line, the average line profile across all pixels in the observations; and green-dash-dotted line, the average penumbral line profile. Positions of line cores (vertical solid green lines), red peaks (vertical solid red lines), or blue peaks (vertical solid blue lines) are marked for those spectral lines where applicable. Shown to the immediate right of the spectral profiles are space-slices (top) and time-slices (bottom) of the studied spectral lines; each panel is marked accordingly. Horizontal lines mark the sampled y-position for the space-slice panels and the sampling time for the time-slice panels. Given to the right of the space-slices are Dopplergrams in the Mg II k & h lines, each panel is marked accordingly, with vertical and horizontal lines surrounding the Mg II PMJ sampling position and the three pixels below and above it. To the right of the Dopplergrams are individual Mg II h (yellow-dashed line) and k (black solid line) spectral profiles for seven pixels along the PMJ IRIS raster slit, with the corresponding bisectors for each spectral line, which are given to their right for both lines. Bisectors that have mean values > |±1| km s−1 are marked with a blue (negative value) or red circle (positive value). To the right of the timeslices we give the current RGB image centred on the PMJ; the sampling positions for each spectral line is indicated with symbols as given in the spectral line panels. Vertical dashed lines indicate the IRIS raster slit positions. An insert in the upper left shows the same FOV and sampling positions, but in the inner blue wing of the SST Ca II 8542 Å line. Above the RGB image, the PMJ identification and the current sampling IRIS slitjaw image index as well as the absolute observation time in seconds are given.
Current usage metrics show cumulative count of Article Views (full-text article views including HTML views, PDF and ePub downloads, according to the available data) and Abstracts Views on Vision4Press platform.
Data correspond to usage on the plateform after 2015. The current usage metrics is available 48-96 hours after online publication and is updated daily on week days.
Initial download of the metrics may take a while.