Fig. 13.
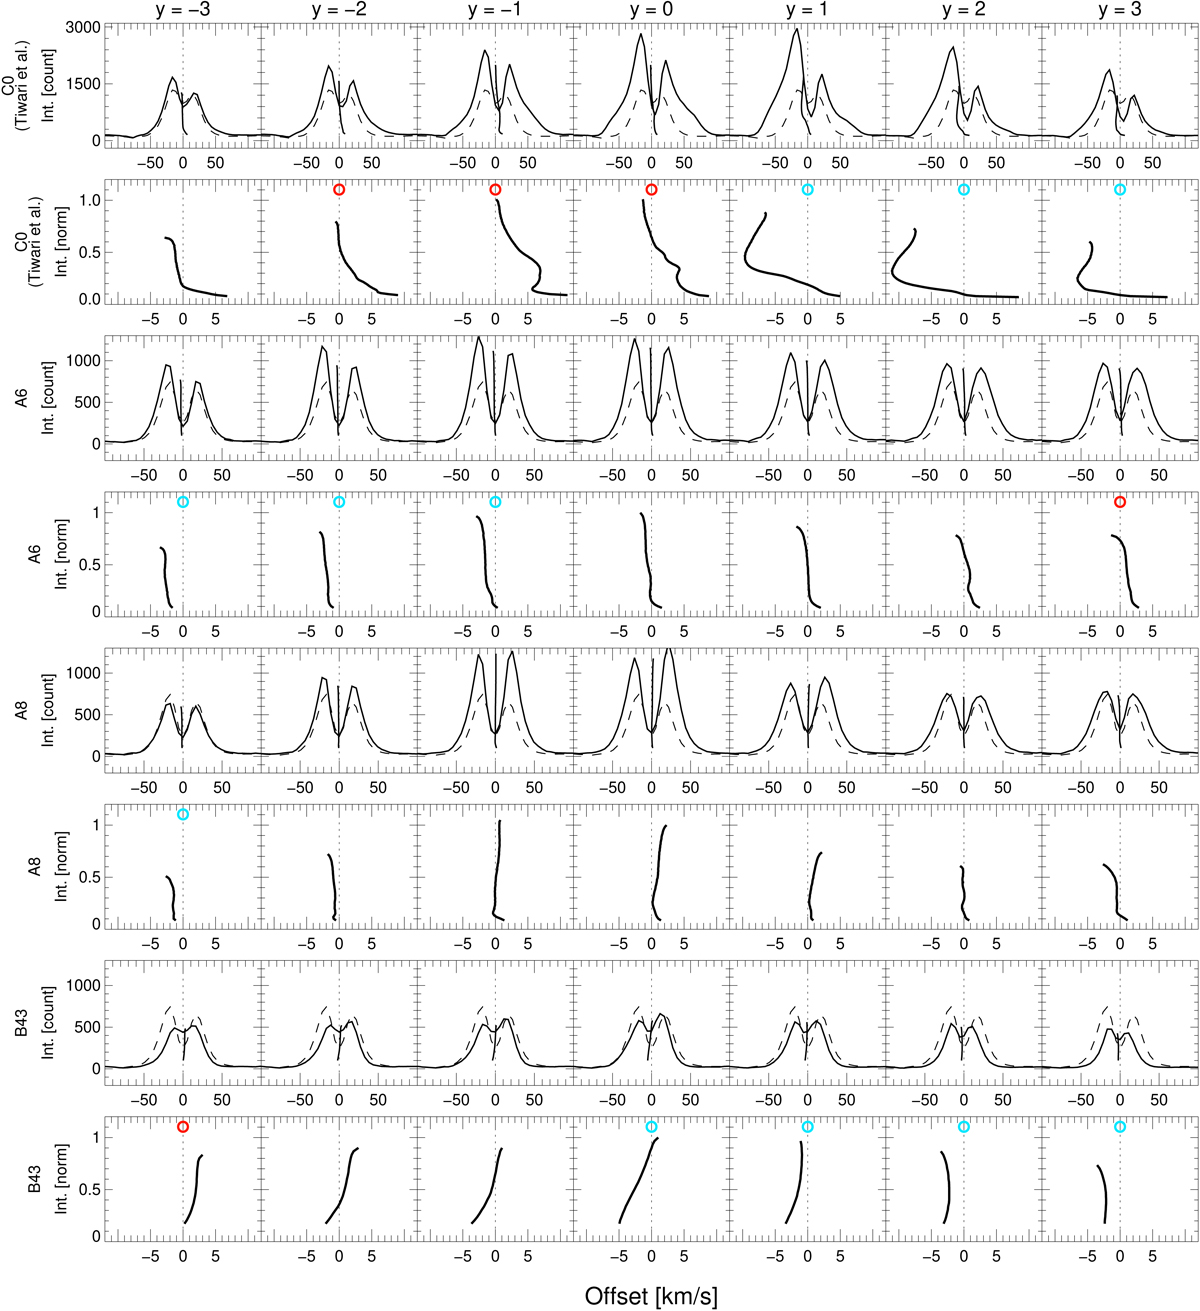
Spectral profiles and their bisectors in the Mg II k line for a selection of PMJs and an LPJ. Panels from left to right show spectral profiles and/or bisectors along the relevant IRIS raster slit at y-axis pixel positions from y = − 3 to y = 3 (as labelled) with y = 0 being the Mg II h & k sampling position of the event. For each given y-pixel position, the top row shows for LPJ event C0 (see text for details) both the Mg II k spectral profile and its associated bisector (both black solid lines) together with the mean Mg II k profile over the entire field of view of event C0’s observations (black-dashed line). The second row displays only the Mg II k bisectors (black solid line) of the same event; panels for bisectors with mean values > |±1| km s−1 are marked with a blue (negative value) or a red circle (positive value). The panels below show the same plots only for selected PMJ events (as labelled on the left), with spectral profiles and bisectors shown together above rows only displaying bisectors. We note that for the PMJ events, the mean spectral profile (black-dashed line) in the plots is instead the mean PMJ profile of the relevant dataset from which the event is drawn.
Current usage metrics show cumulative count of Article Views (full-text article views including HTML views, PDF and ePub downloads, according to the available data) and Abstracts Views on Vision4Press platform.
Data correspond to usage on the plateform after 2015. The current usage metrics is available 48-96 hours after online publication and is updated daily on week days.
Initial download of the metrics may take a while.