Fig. 12.
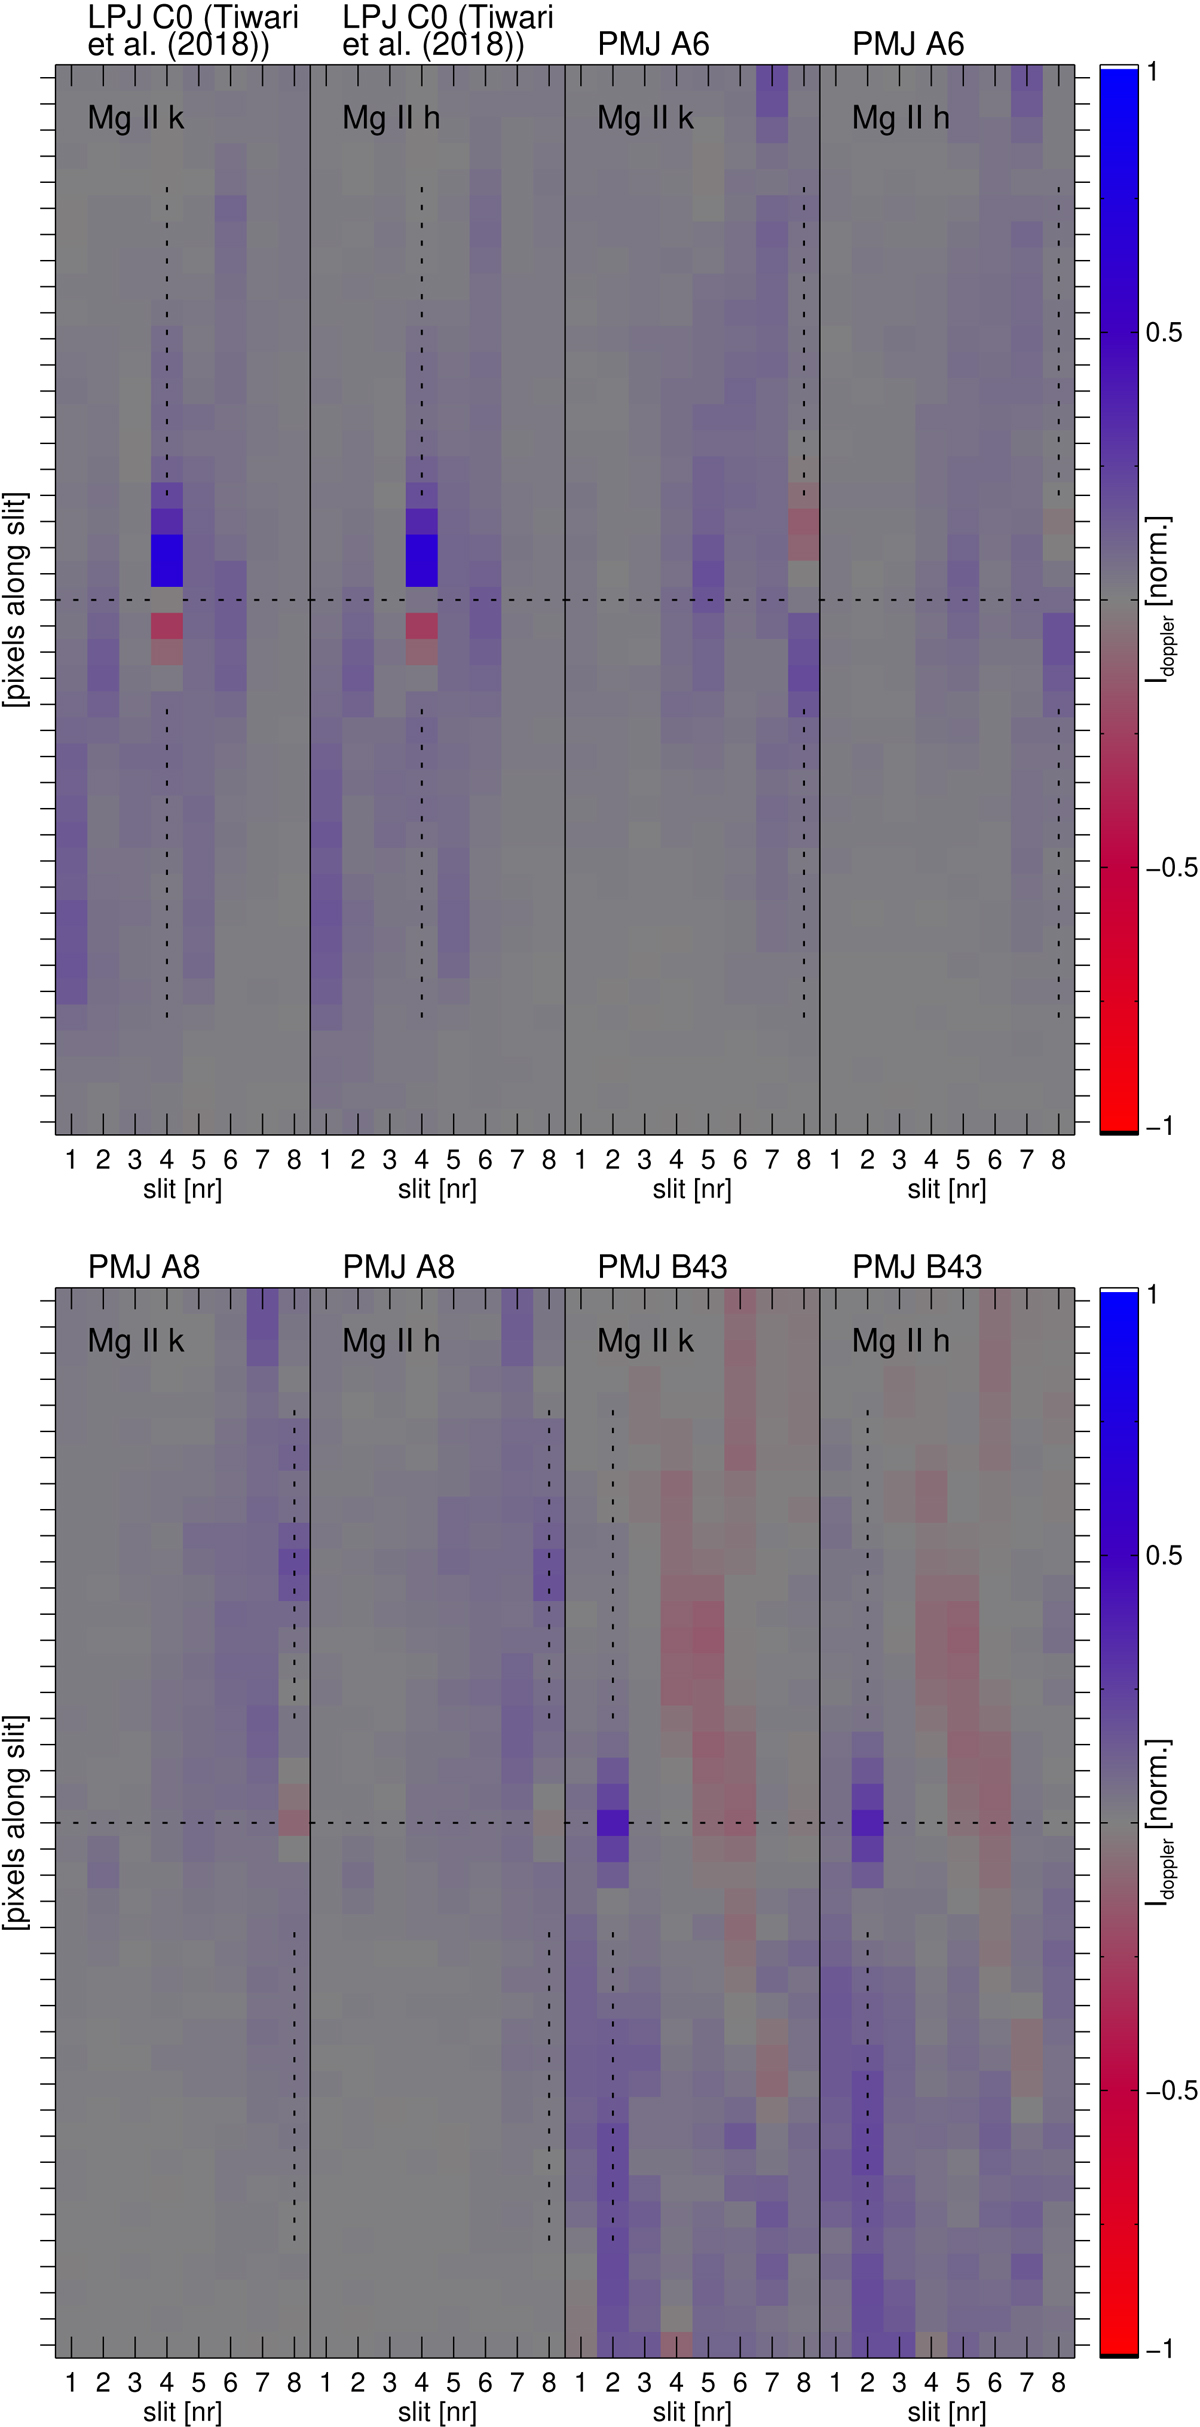
Doppler maps in the Mg II k & h lines for a selection of PMJ and LPJ events. The Doppler maps cover all eight IRIS raster-slit positions along the x-axes and 41 pixels along the y-axis, with the nominal Mg II h & k sampling position at the centre of the y-axis. Horizontal dashed lines enclose the sampling position, and vertical dashed lines surround the sampling position and the three pixels above and below it. Maps are labelled with the relevant Mg II line and event identifiers. Doppler map values have a range of (−1,1) with negative values in red, signifying red enhancement, and positive values in blue, signifying blue enhancement. The intensity value Idoppler is defined in the text.
Current usage metrics show cumulative count of Article Views (full-text article views including HTML views, PDF and ePub downloads, according to the available data) and Abstracts Views on Vision4Press platform.
Data correspond to usage on the plateform after 2015. The current usage metrics is available 48-96 hours after online publication and is updated daily on week days.
Initial download of the metrics may take a while.