Fig. 10.
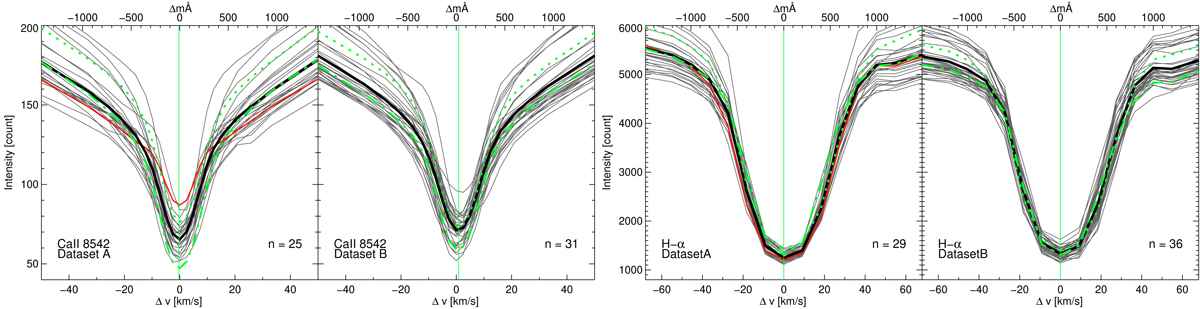
Spectral signatures of PMJ dark features and reference average profiles in the Ca II 8542 Å and H α line from the CRISP instrument for datasets A and B as indicated. The different line styles for the various H α line profiles denote the following: grey solid lines, the line profiles of dark features for PMJs that clearly exhibit such features in the observations; red solid line, spectral profiles of event A10; black solid line, the average profile of this sample of PMJ dark features; green-dotted line, the average line profile across all pixels in the observations; and green-dash-dotted line, the average line profile in the penumbra of AR12533.
Current usage metrics show cumulative count of Article Views (full-text article views including HTML views, PDF and ePub downloads, according to the available data) and Abstracts Views on Vision4Press platform.
Data correspond to usage on the plateform after 2015. The current usage metrics is available 48-96 hours after online publication and is updated daily on week days.
Initial download of the metrics may take a while.