Fig. 1.
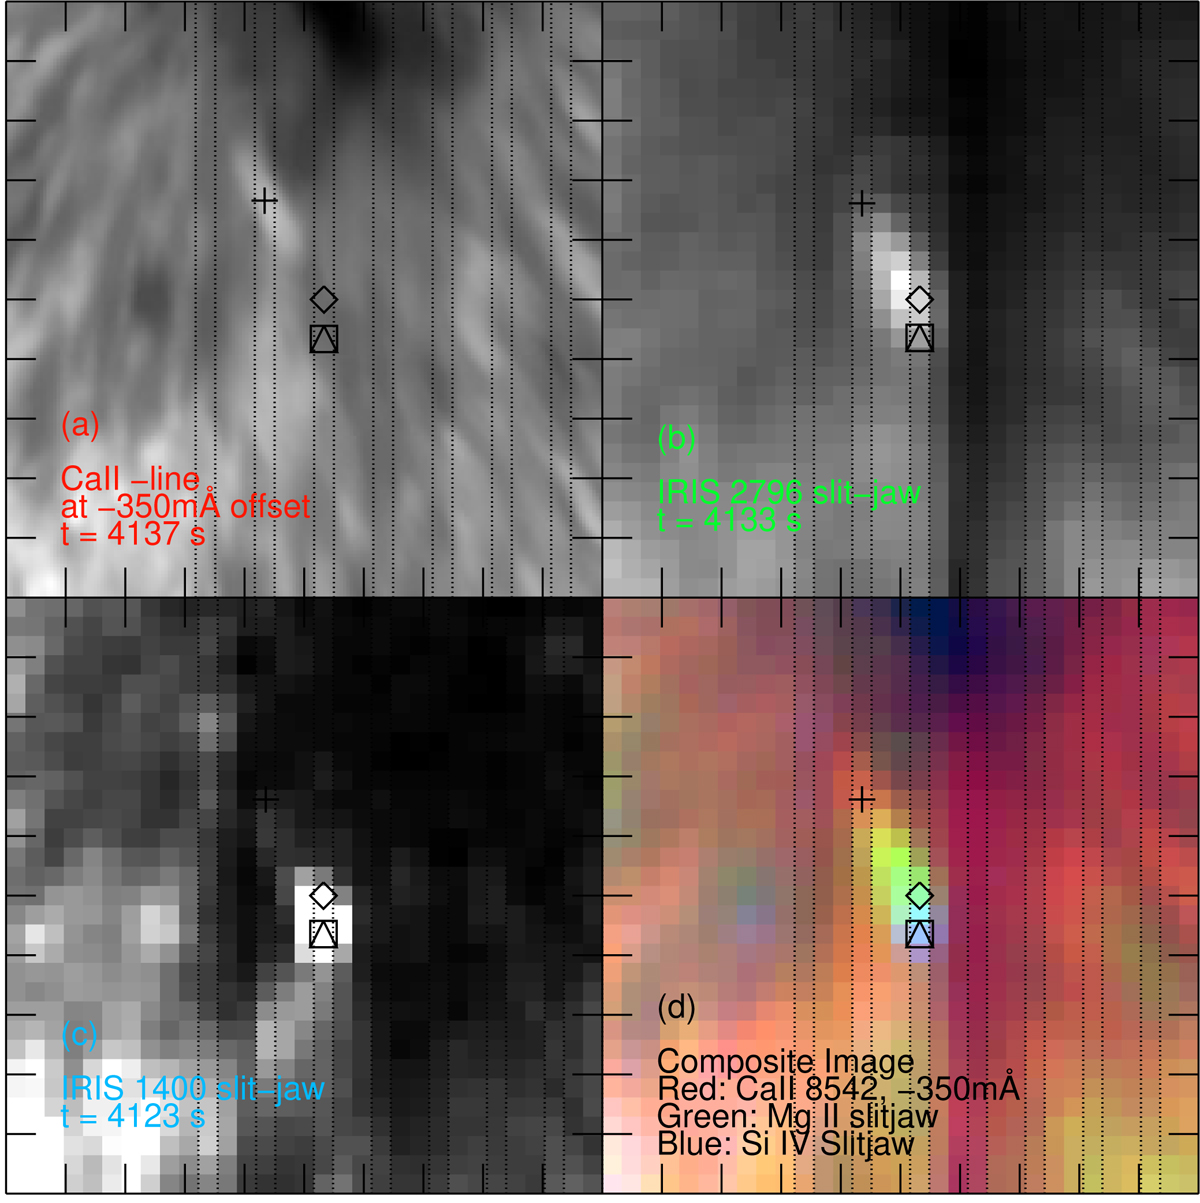
Example PMJ from dataset B. Observations of (a) the SST Ca II 8542 Å line at an offset of −350 mÅ, (b) the IRIS SJI 2796, (c) the IRIS SJI 1400, and (d) the composite RGB image created from the three preceding images are shown. Tick-mark spacing is 1″. The images were cropped with the PMJ at their approximate centres. Symbols mark the sampling positions for analysis of spectral line profiles. Cross: Ca II 8542 Å, diamond: the Mg II k, h, and triplet lines, square: C II 1334 Å and 1335 Å lines, triangle: Si IV 1394 Å and 1403 Å lines. The slit positions (of one-pixel width) of IRIS are denoted in each panel by black-dotted lines. Tick marks are spaced 1″ apart.
Current usage metrics show cumulative count of Article Views (full-text article views including HTML views, PDF and ePub downloads, according to the available data) and Abstracts Views on Vision4Press platform.
Data correspond to usage on the plateform after 2015. The current usage metrics is available 48-96 hours after online publication and is updated daily on week days.
Initial download of the metrics may take a while.