Fig. 9
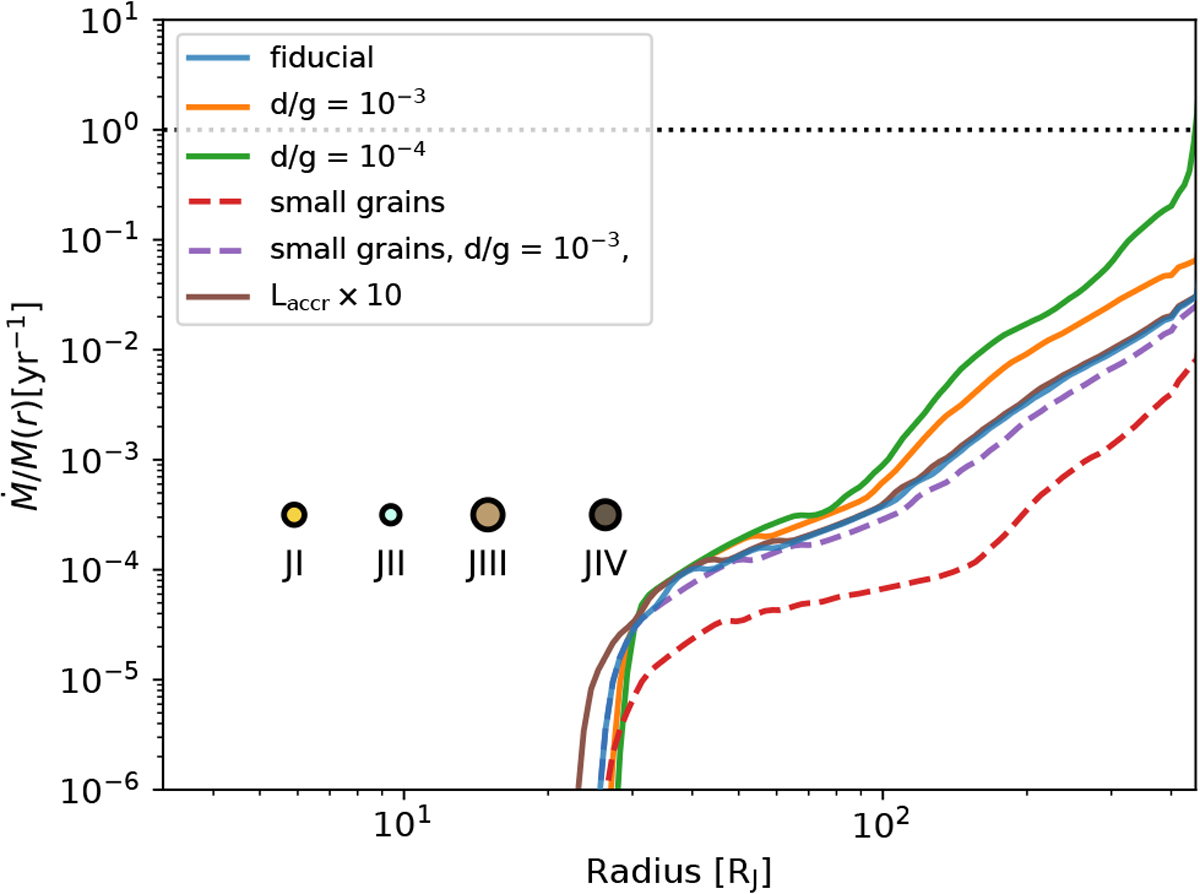
Radial photoevaporative mass loss in the CPD as a fraction of the mass available in the respective annulus of the steady-state surface density profile for a variety of modifications to the fiducial CPD model (MCPD = 10−7M⊙, G0 = 103). The red and purple curves labeled “small grains” represent the case where the maximum grain size is 10 μm. The orange, green, and purple curves represent the cases of varying dust-to-gas ratio. The brown curve shows the case of additional planetary UV luminosity originating from accretion, ten times greater than in the fiducial case of planetary UV luminosity. The horizontal dashed black line represents the mass-loss rate at which an annulus would be entirely depleted within one year. The colored circles indicate the current semimajor axes of the Galilean satellites as described in Fig. 7.
Current usage metrics show cumulative count of Article Views (full-text article views including HTML views, PDF and ePub downloads, according to the available data) and Abstracts Views on Vision4Press platform.
Data correspond to usage on the plateform after 2015. The current usage metrics is available 48-96 hours after online publication and is updated daily on week days.
Initial download of the metrics may take a while.