Fig. 4
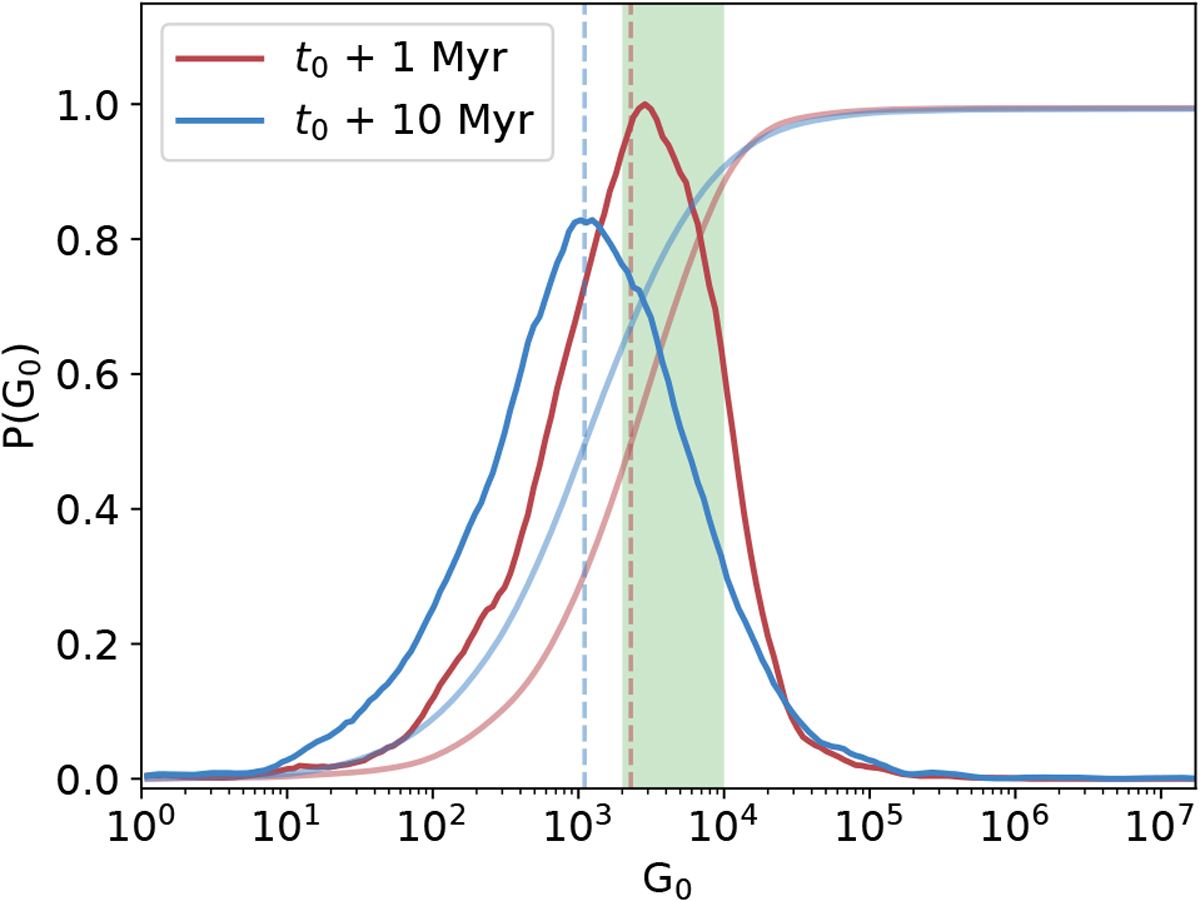
Probability distribution of the intracluster radiation field strength G0 at the position of each cluster star over time, normalized to the maximum likelihood value at t = t0 + 1 Myr. The distribution evolves over 10 Myr from t = t0 + 1 Myr (red) and to t = t0 + 10 Myr (blue). The faded solid lines illustrate the cumulative distributions. The vertical dashed lines indicate the median value of each distribution. The green bar indicates the Solar System constraint of 2000 ≤ G0 ≤ 104. Multiple initializations of the cluster have been averaged to minimize the Poisson noise because the number of stars is small (Nstars = 2500).
Current usage metrics show cumulative count of Article Views (full-text article views including HTML views, PDF and ePub downloads, according to the available data) and Abstracts Views on Vision4Press platform.
Data correspond to usage on the plateform after 2015. The current usage metrics is available 48-96 hours after online publication and is updated daily on week days.
Initial download of the metrics may take a while.