Fig. 3
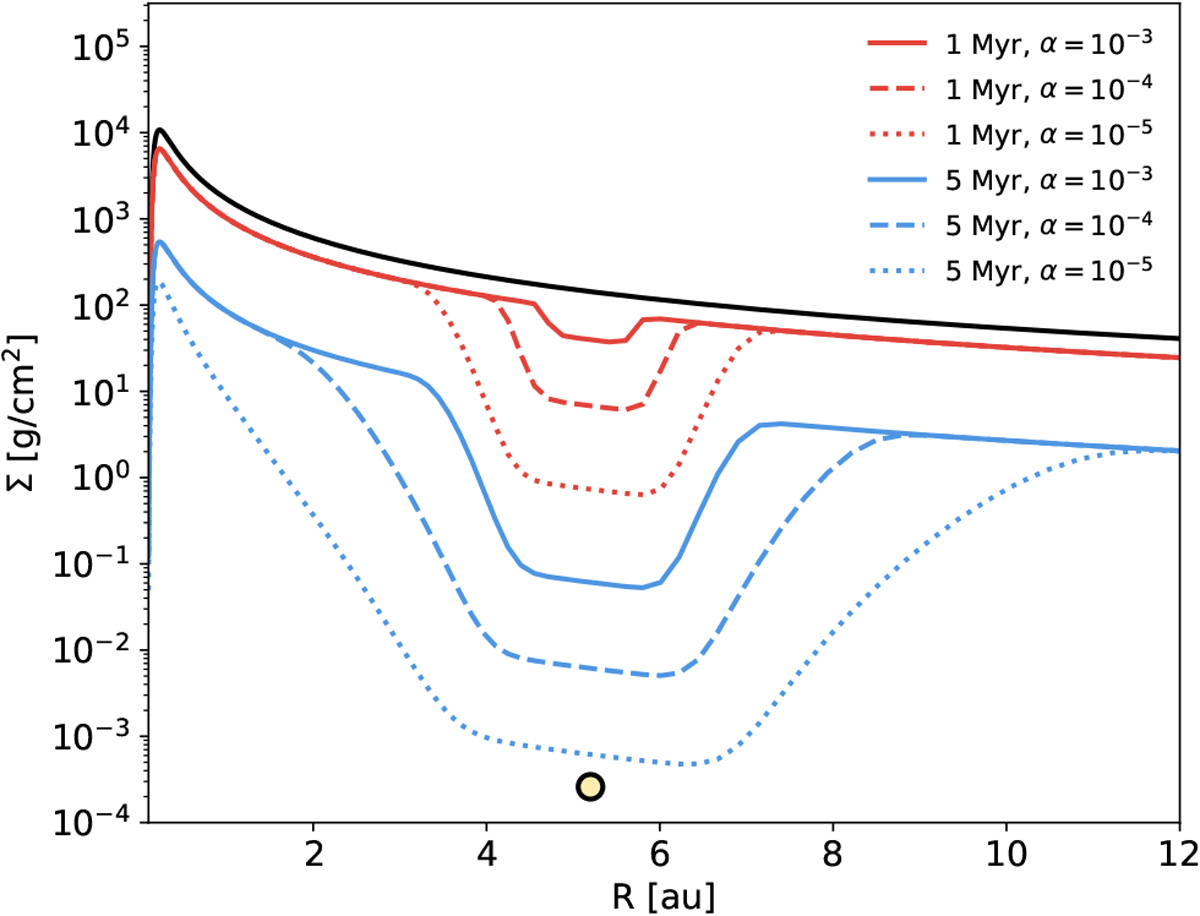
Surface density profiles of the solar protoplanetary disk. The red profiles show the earliest gap-opening phase when Mp = 0.1 MJ case at t = 1 Myr when the disk has been reduced to 60% of its initial mass. The blue profiles show the Mp = 1 MJ case where the remaining disk mass is 5% of the initial mass. The black line plots the unperturbed disk surface density at t0 with a total mass of 0.02 M⊙. The orange dot indicates the radial location of Jupiter.
Current usage metrics show cumulative count of Article Views (full-text article views including HTML views, PDF and ePub downloads, according to the available data) and Abstracts Views on Vision4Press platform.
Data correspond to usage on the plateform after 2015. The current usage metrics is available 48-96 hours after online publication and is updated daily on week days.
Initial download of the metrics may take a while.