Fig. 6.
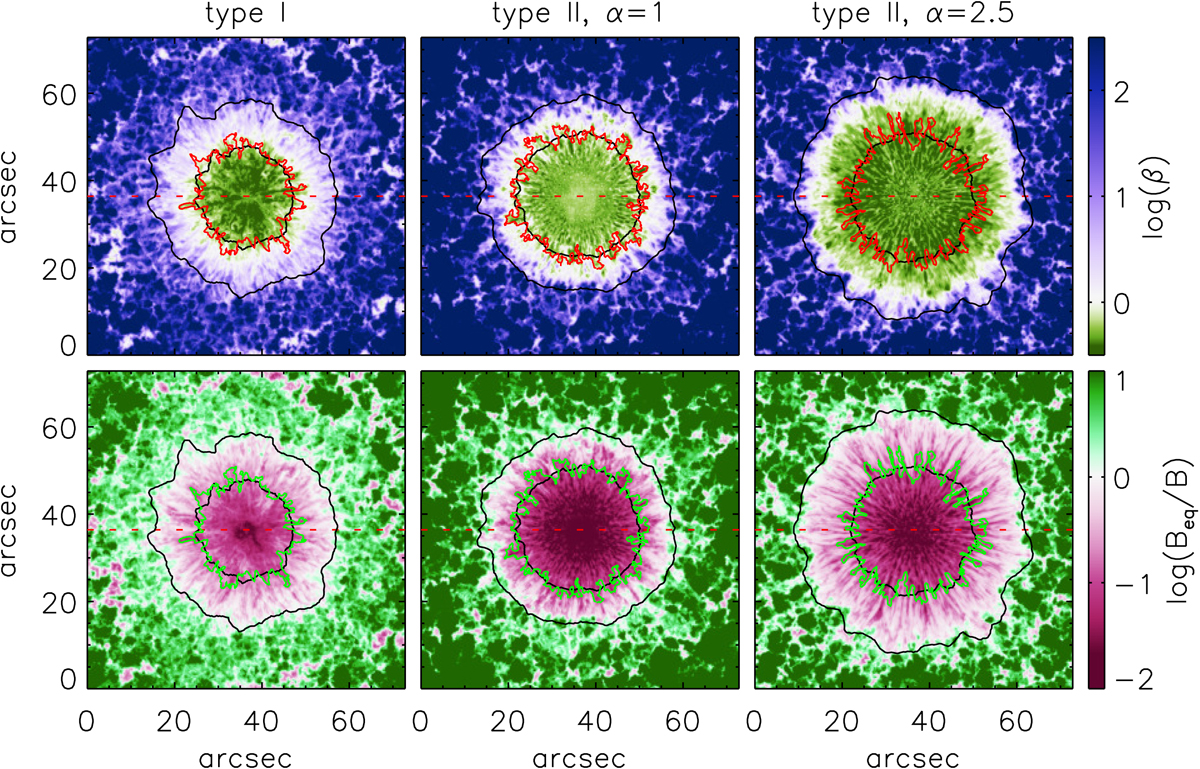
Maps of log(β) (top row) and log(Beq/B) (bottom row) at the continuum formation height (τ500 = 1) for different simulation runs. The red (top) and green (bottom row) contours mark the UP boundaries defined at ![]() . The black contours mark the position of the outer sunspot boundaries and the mean position of the UP boundaries that are defined for the purposes of azimuthal averaging (see Fig. 5). The red dashed lines through the middle of the spots mark the position of the cuts shown in Fig. 8.
. The black contours mark the position of the outer sunspot boundaries and the mean position of the UP boundaries that are defined for the purposes of azimuthal averaging (see Fig. 5). The red dashed lines through the middle of the spots mark the position of the cuts shown in Fig. 8.
Current usage metrics show cumulative count of Article Views (full-text article views including HTML views, PDF and ePub downloads, according to the available data) and Abstracts Views on Vision4Press platform.
Data correspond to usage on the plateform after 2015. The current usage metrics is available 48-96 hours after online publication and is updated daily on week days.
Initial download of the metrics may take a while.