Fig. 5.
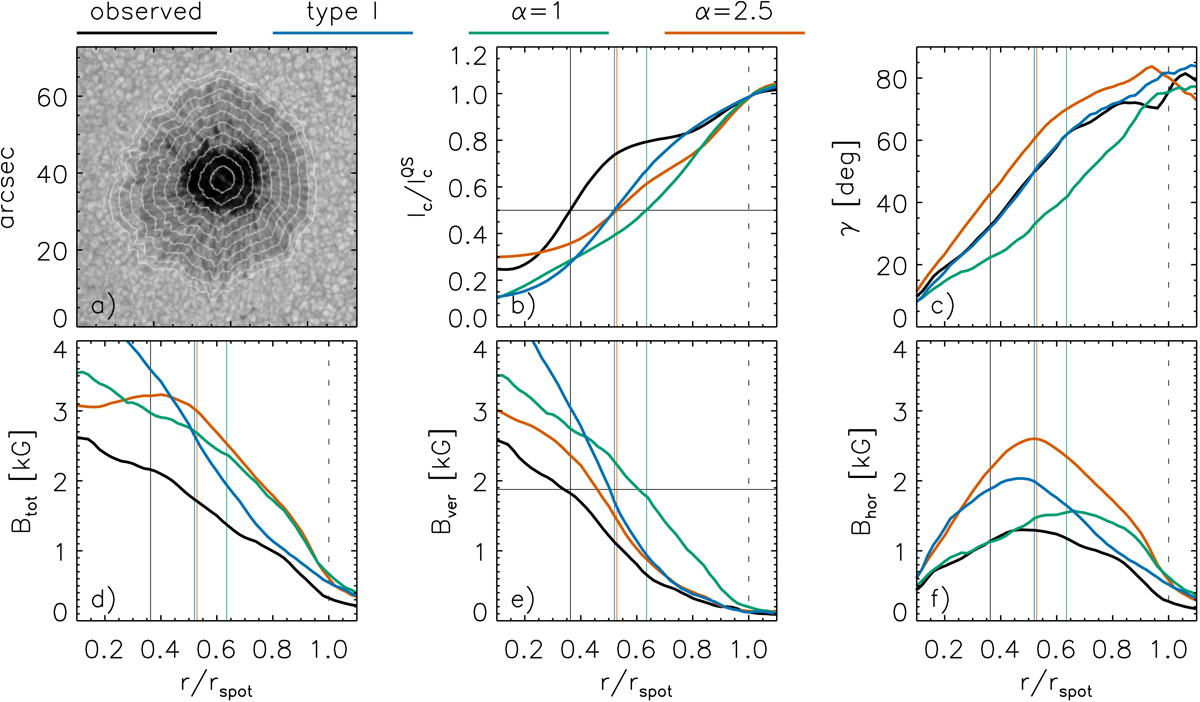
Radial profiles of continuum intensity (Ic, b), magnetic field inclination (γ, c), total magnetic field strength (Btot, d), vertical magnetic field strength (Bver, e), and horizontal magnetic field strength (Bhor, f). The continuum intensity map of the observed sunspot with contours marking relative radial positions from 0.1 to 1 is shown in panel a. The solid vertical lines mark the UP boundaries, the dashed vertical lines mark the boundary between penumbra and quiet Sun. The horizontal lines in panels b and e mark the ![]() and 1876 G, respectively.
and 1876 G, respectively.
Current usage metrics show cumulative count of Article Views (full-text article views including HTML views, PDF and ePub downloads, according to the available data) and Abstracts Views on Vision4Press platform.
Data correspond to usage on the plateform after 2015. The current usage metrics is available 48-96 hours after online publication and is updated daily on week days.
Initial download of the metrics may take a while.