Fig. 3.
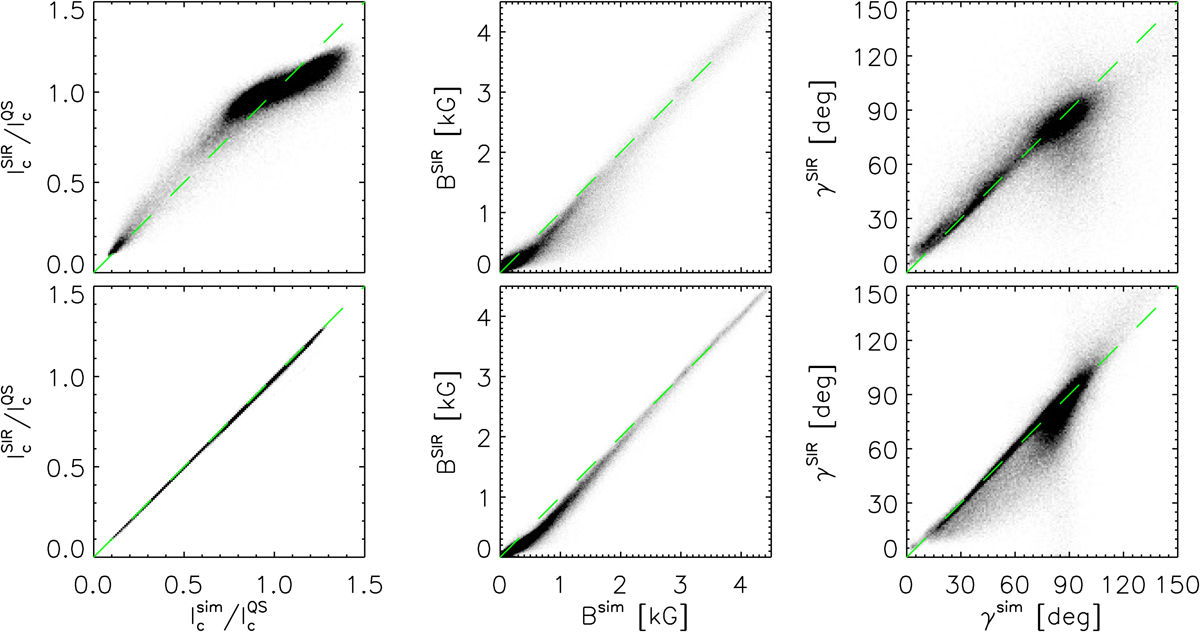
Scatter plots showing the accuracy of the inverted parameters with respect to the actual values in the simulation box (average values between log τ = −1 and −2). The values on the horizontal axis are taken directly from the simulation box in the upper row. Bottom row: these values are smoothed by the spatial PSF. The dashed green lines mark the one-to-one correspondence.
Current usage metrics show cumulative count of Article Views (full-text article views including HTML views, PDF and ePub downloads, according to the available data) and Abstracts Views on Vision4Press platform.
Data correspond to usage on the plateform after 2015. The current usage metrics is available 48-96 hours after online publication and is updated daily on week days.
Initial download of the metrics may take a while.