Fig. 8.
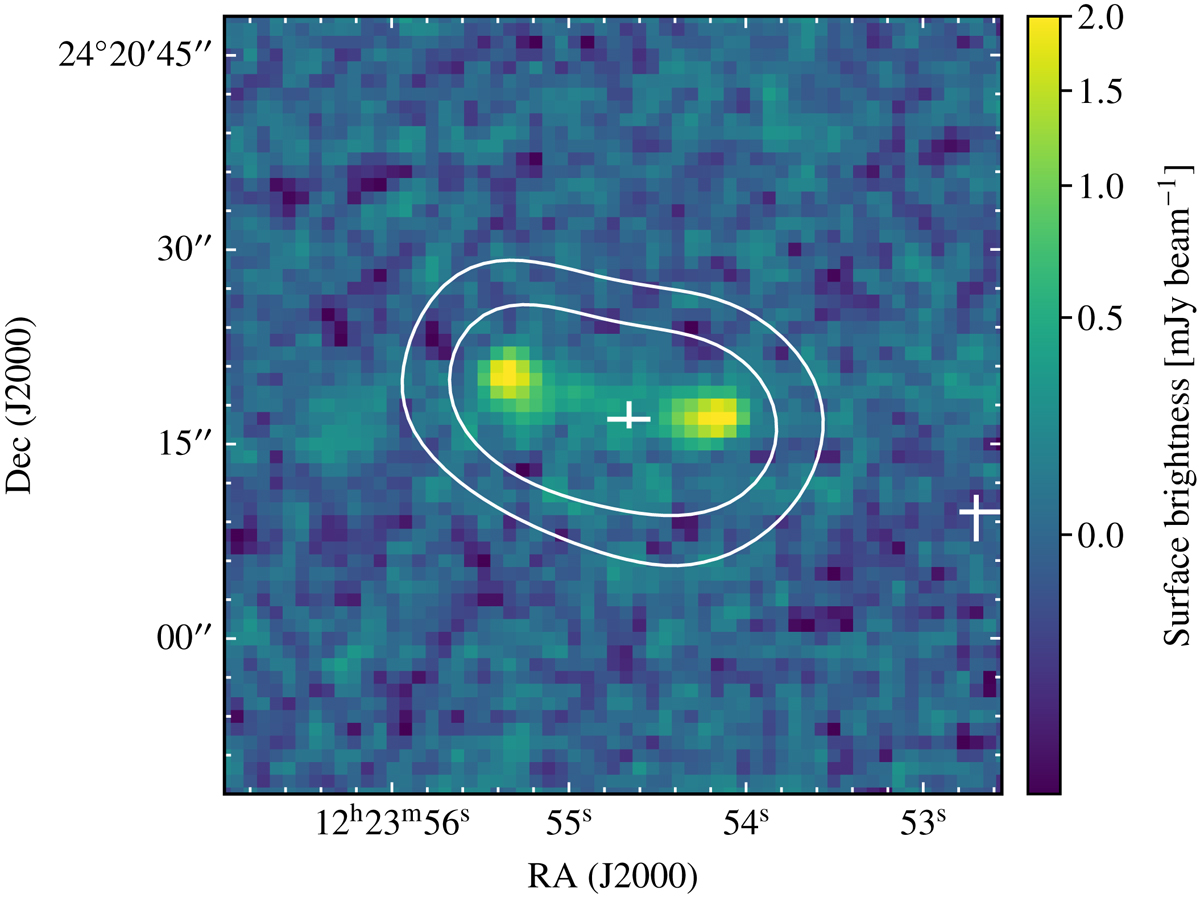
VLASS map of the radio structure in MOO J1223+2420. Overplotted are the contours from the same image smoothed to ACA resolution (the levels correspond to the arbitrary values of 0.10 and 0.05 mJy beam−1). The white crosses denote the position of the most significant point sources and respective uncertainties from the 68% credibility interval around each posterior peak. Regardless of the accuracy in the determination of the position of any point-like sources, the low resolution of ACA does not resolve the possible different contributions from the jets and the central galaxy.
Current usage metrics show cumulative count of Article Views (full-text article views including HTML views, PDF and ePub downloads, according to the available data) and Abstracts Views on Vision4Press platform.
Data correspond to usage on the plateform after 2015. The current usage metrics is available 48-96 hours after online publication and is updated daily on week days.
Initial download of the metrics may take a while.