Fig. 7.
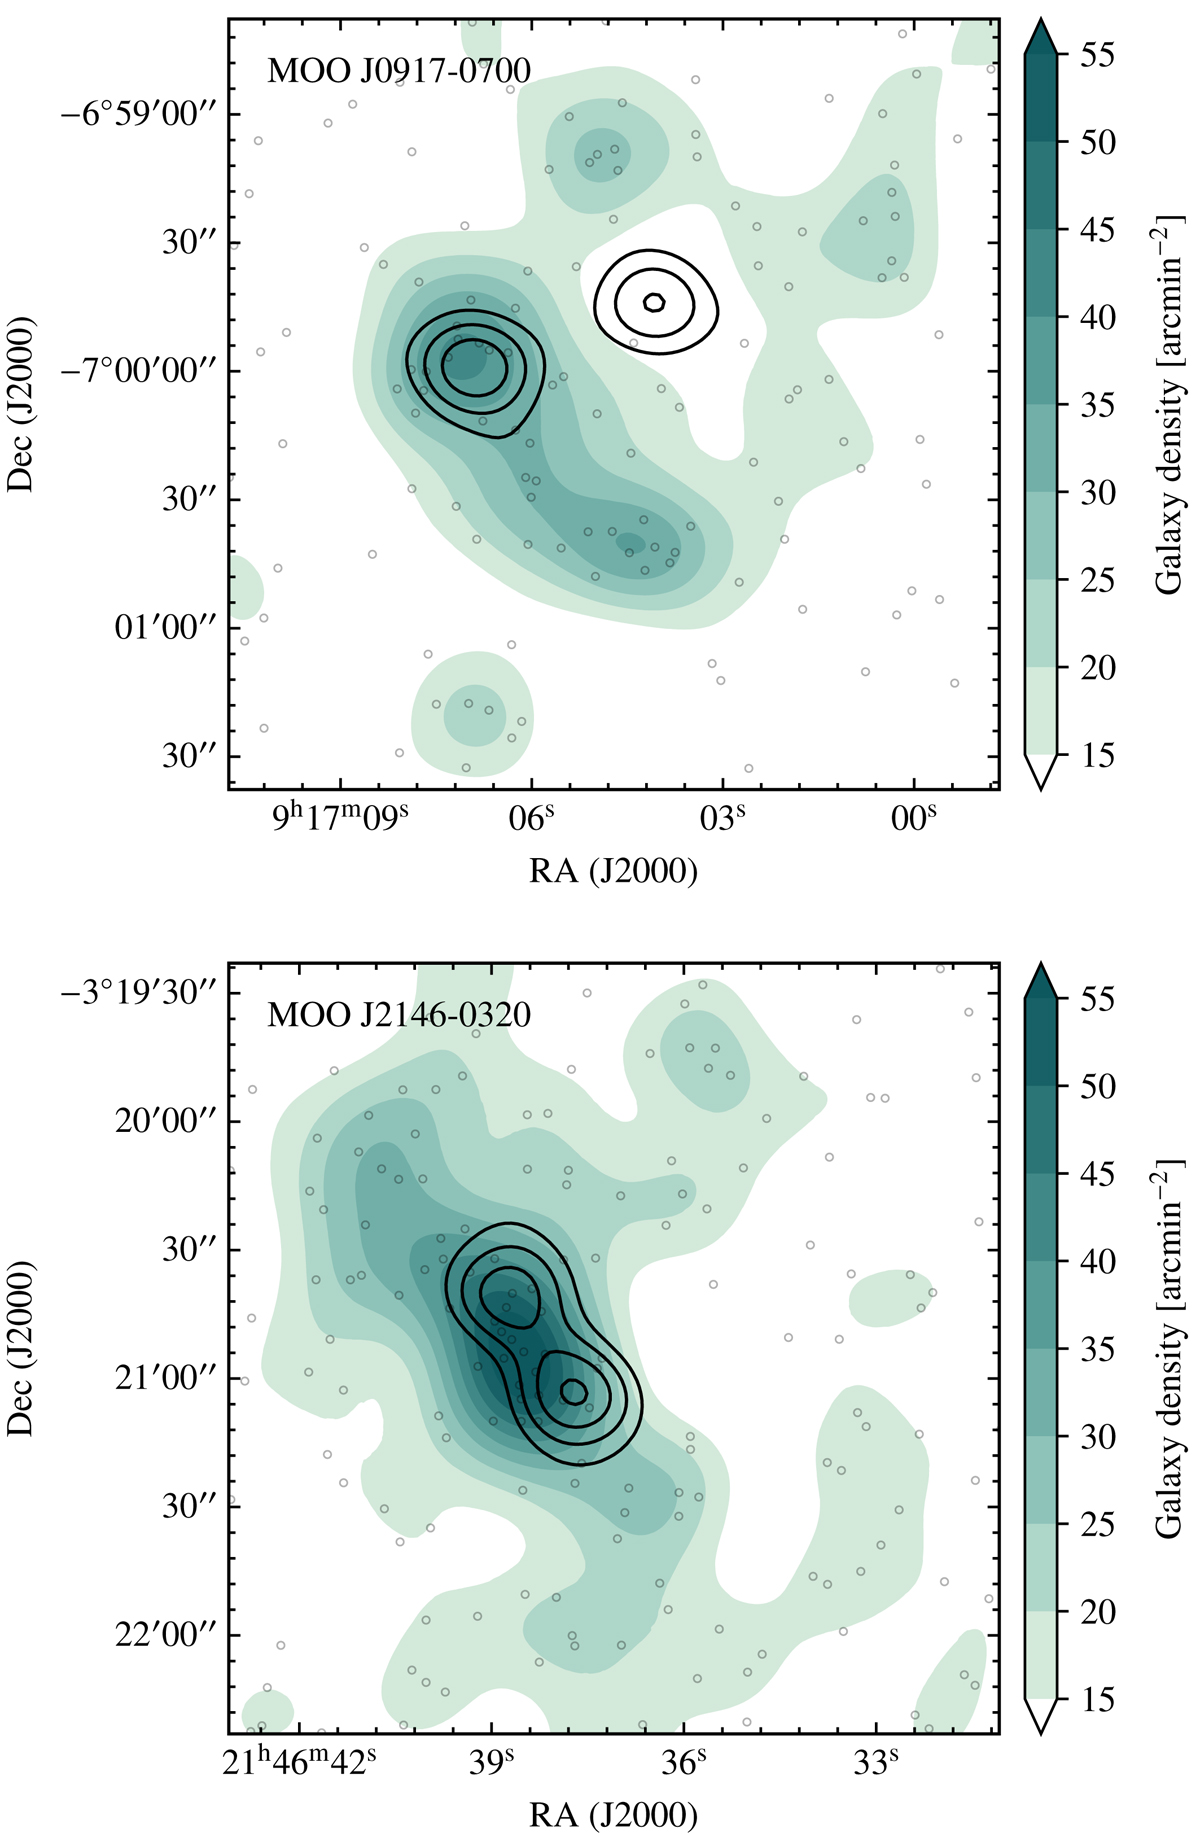
Maps of the color-selected galaxy overdensities around MOO J0917−0700 and MOO J2146−0320, as measured by Spitzer/IRAC. Overplotted are the contours of the SZ models of the two clusters, as in Fig. 6. In both cases the elongated morphology of the galaxy density distribution may support the merger scenario. The light gray points denote the positions of the individual IRAC-selected galaxies. For display purposes, the galaxy overdensity maps have been preliminary smoothed by a Gaussian kernel with standard deviation of ∼12 arcsec.
Current usage metrics show cumulative count of Article Views (full-text article views including HTML views, PDF and ePub downloads, according to the available data) and Abstracts Views on Vision4Press platform.
Data correspond to usage on the plateform after 2015. The current usage metrics is available 48-96 hours after online publication and is updated daily on week days.
Initial download of the metrics may take a while.