Fig. 6.
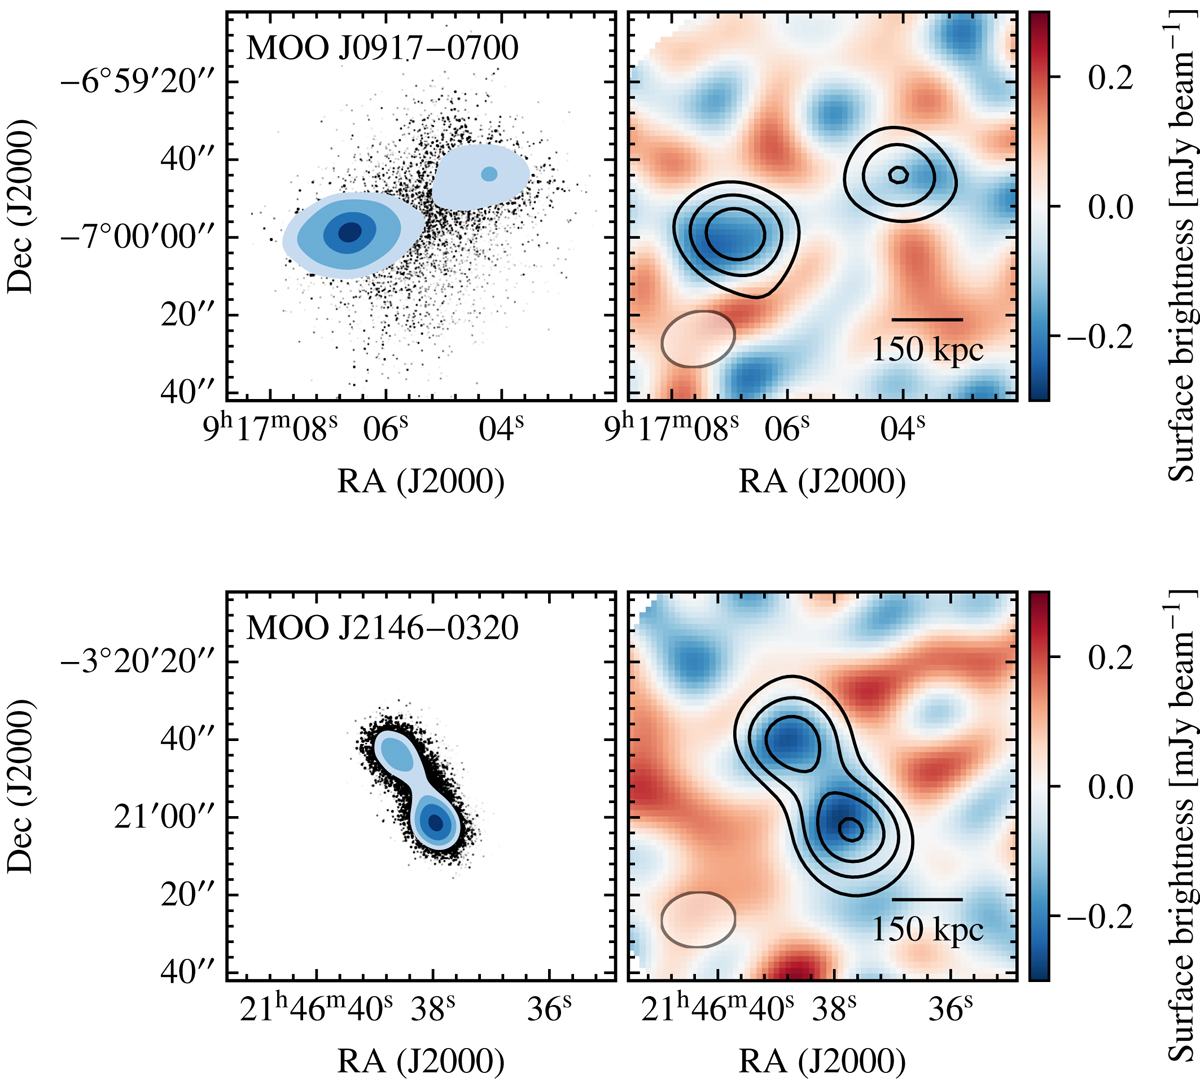
Marginalized posterior for the cluster centroids and dirty images (left and right panels, respectively) of the two VACA LoCA clusters characterized by multiple SZ features, MOO J0917−0700 and MOO J2146−0320 (top and bottom panels, respectively). The posterior contours correspond (from innermost to outermost) to 38%, 68%, 87%, and 95% credibility levels. Contours in the right panels show the 0.5σ, 1σ, 1.5σ, and 2σ statistical significance levels of the filtered model with respect to the map noise rms. To better highlight the SZ effect, we subtract from the visibility data the most significant point-like sources, as in Fig. 3, and apply a 10 kλ taper to the data.
Current usage metrics show cumulative count of Article Views (full-text article views including HTML views, PDF and ePub downloads, according to the available data) and Abstracts Views on Vision4Press platform.
Data correspond to usage on the plateform after 2015. The current usage metrics is available 48-96 hours after online publication and is updated daily on week days.
Initial download of the metrics may take a while.