Fig. 5.
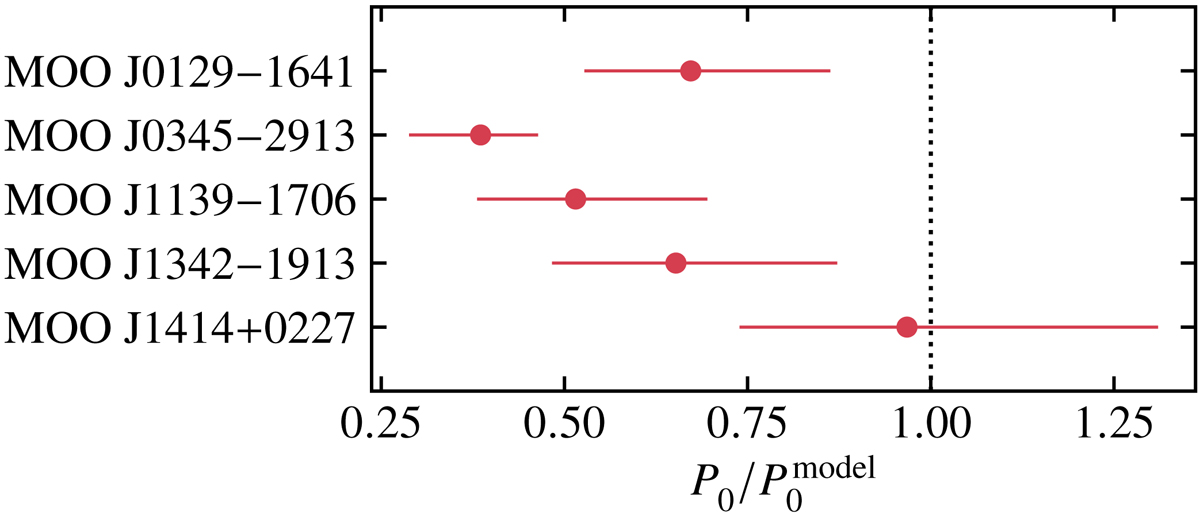
Inferred pressure normalization P0 when assuming a cluster mass derived using the mass–richness relation from Gonzalez et al. (2019) and a universal pressure profile (Arnaud et al. 2010). The ratios reported here are normalized by the nominal value for P0 given in Table 2. As discussed in Sect. 4.1, the observed scatter indicates a true discrepancy, which could be due to deviations from the Gonzalez et al. (2019) mass–richness scaling or to deviations from the Arnaud et al. (2010) ensemble-average pressure profile. If ACA filtering were driving the mass reconstruction, we would expect a uniformly low value for the ratio, which is not observed. The error bars for each of the points incorporates both statistical uncertainties and scatter intrinsic to MaDCoWS mass–richness scaling relation.
Current usage metrics show cumulative count of Article Views (full-text article views including HTML views, PDF and ePub downloads, according to the available data) and Abstracts Views on Vision4Press platform.
Data correspond to usage on the plateform after 2015. The current usage metrics is available 48-96 hours after online publication and is updated daily on week days.
Initial download of the metrics may take a while.