Fig. 4.
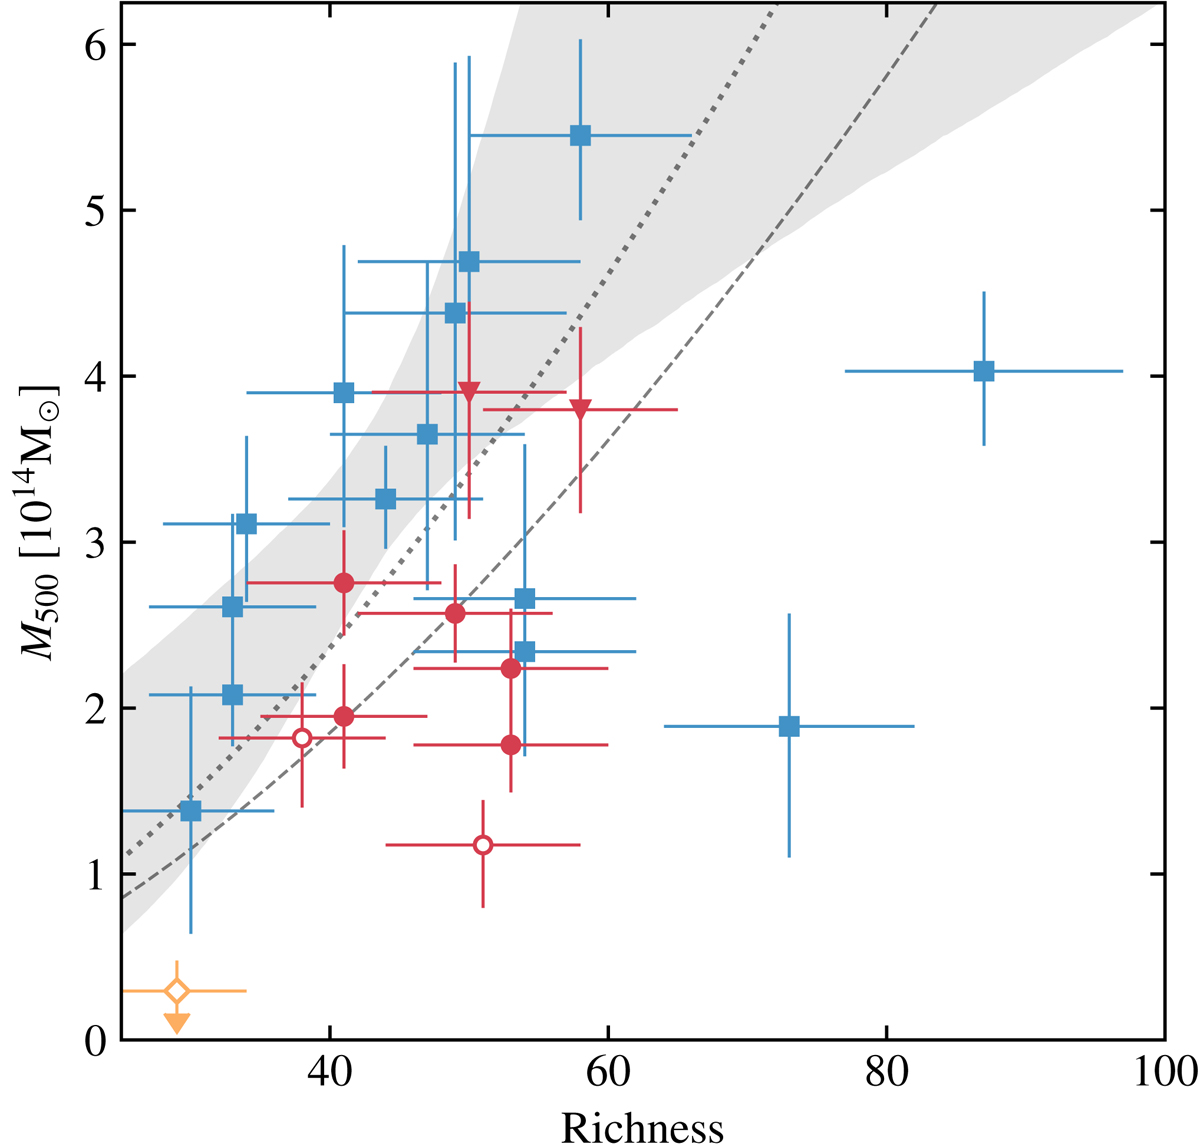
Mass vs. richness relation for all the MaDCoWS clusters with SZ-based mass estimates. The blue squares correspond to the CARMA MaDCoWS cluster sample from Gonzalez et al. (2019). In solid red are the clusters from this work that have been significantly detected, while open red points denote the clusters MOO J1223+2420 and MOO J2147+1314, with only weak statistical support for the presence of SZ signal. The upper limit for non-detected MOO J0903+1310 is denoted with a yellow open diamond. We use circles and triangles for the clusters with single or double SZ features, respectively. In the latter case, the plot reports the sum of the masses of the individual SZ components. The shaded region is the 68% confidence interval for the mass-scaling relation reported in Gonzalez et al. (2019). The VACA LoCA distribution is observed to lie below the mass–richness relation previously reported, highlighting potential systematics in the mass reconstruction from either or both the CARMA and ACA observations. The dashed and dotted lines correspond to the mass–richness scaling derived in Sect. 4.1 respectively from the VACA LoCA points only (excluding the non-detection) and from the joint modeling of the VACA LoCA and CARMA measurements.
Current usage metrics show cumulative count of Article Views (full-text article views including HTML views, PDF and ePub downloads, according to the available data) and Abstracts Views on Vision4Press platform.
Data correspond to usage on the plateform after 2015. The current usage metrics is available 48-96 hours after online publication and is updated daily on week days.
Initial download of the metrics may take a while.