Fig. 3.
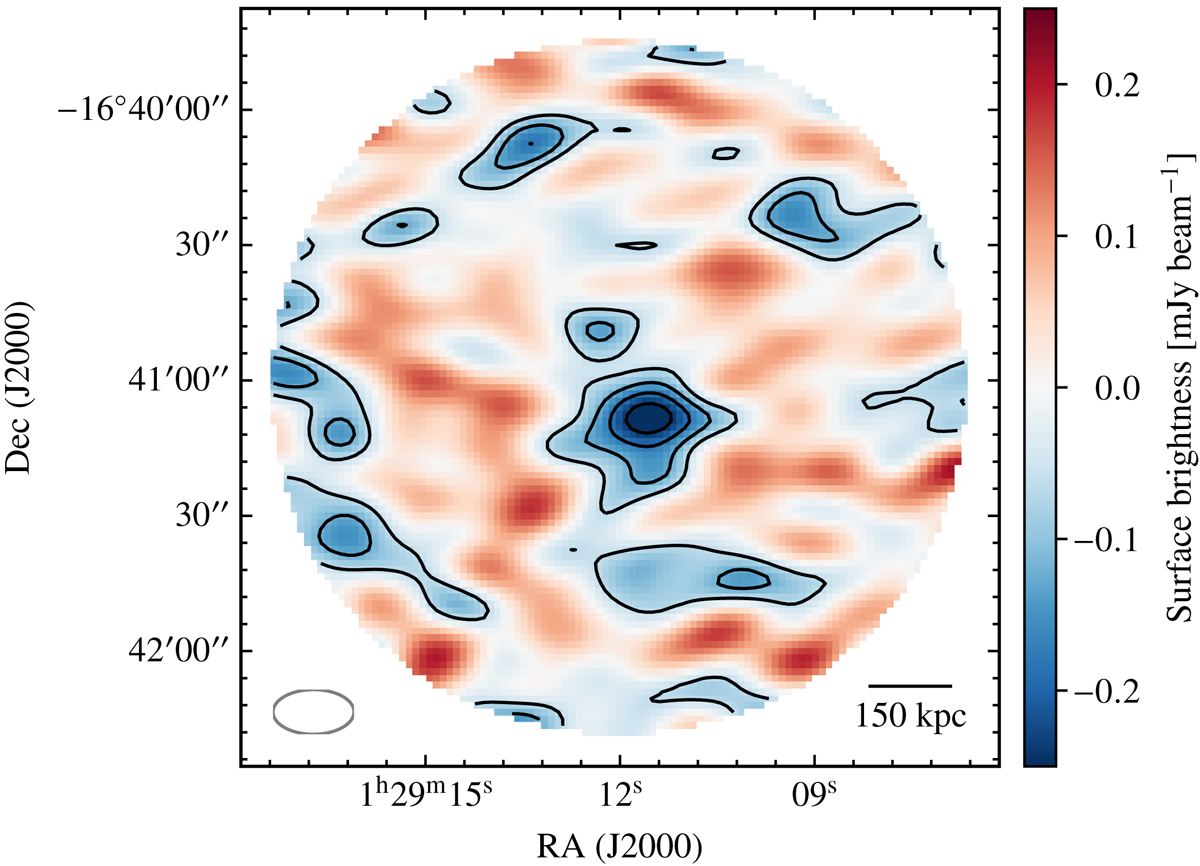
Dirty image of MOO J0129−1640 generated from point source-subtracted visibilities. The point source components are identified as the peaks in the joint posterior probability distribution point source position parameters. The contours correspond to the 1σ, 2σ, 3σ, and 4σ significance levels of the SZ signal, with σ = 0.061 mJy beam−1. Although the integrated SZ decrement is detected at σeff = 7.77 (Table 3), the peak SZ amplitude has a significance only slightly higher than 4σ when measured in image space.
Current usage metrics show cumulative count of Article Views (full-text article views including HTML views, PDF and ePub downloads, according to the available data) and Abstracts Views on Vision4Press platform.
Data correspond to usage on the plateform after 2015. The current usage metrics is available 48-96 hours after online publication and is updated daily on week days.
Initial download of the metrics may take a while.