Fig. 2.
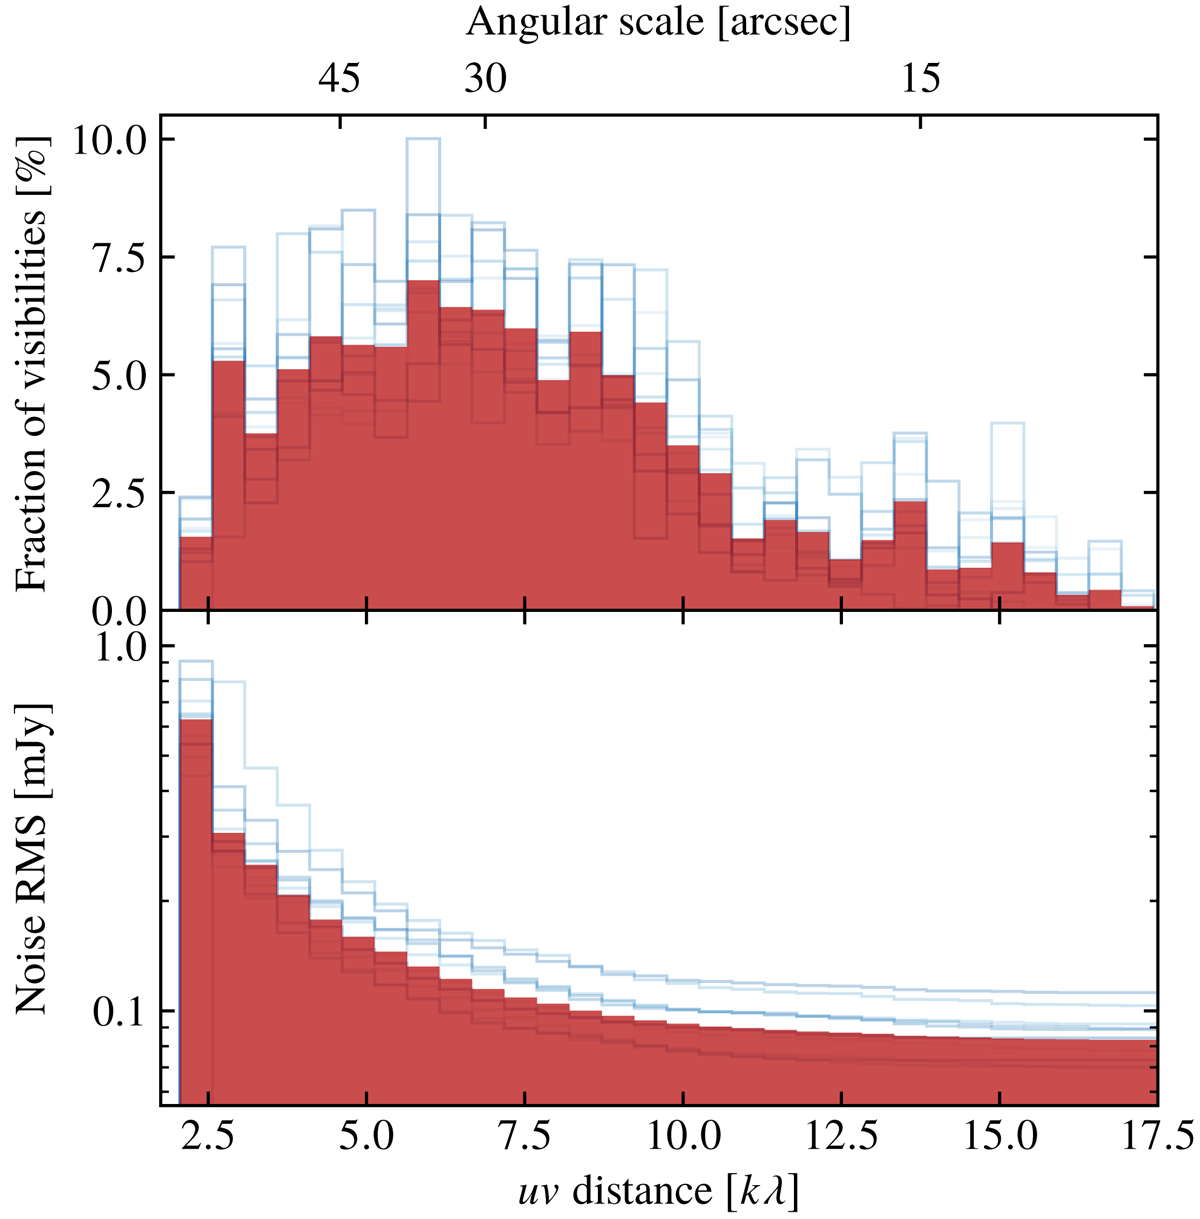
Fraction of visibility points for a given bin of uv distances (top) and corresponding cumulative noise root mean square (rms; bottom). The blue lines correspond to the individual fields, while the red shaded region to their average. The clear flattening of the cumulative noise curve for uv distance larger than around 10 kλ suggests the sensitivity budget is overall dominated by short baselines (i.e., large-scale modes).
Current usage metrics show cumulative count of Article Views (full-text article views including HTML views, PDF and ePub downloads, according to the available data) and Abstracts Views on Vision4Press platform.
Data correspond to usage on the plateform after 2015. The current usage metrics is available 48-96 hours after online publication and is updated daily on week days.
Initial download of the metrics may take a while.