Fig. C.2.
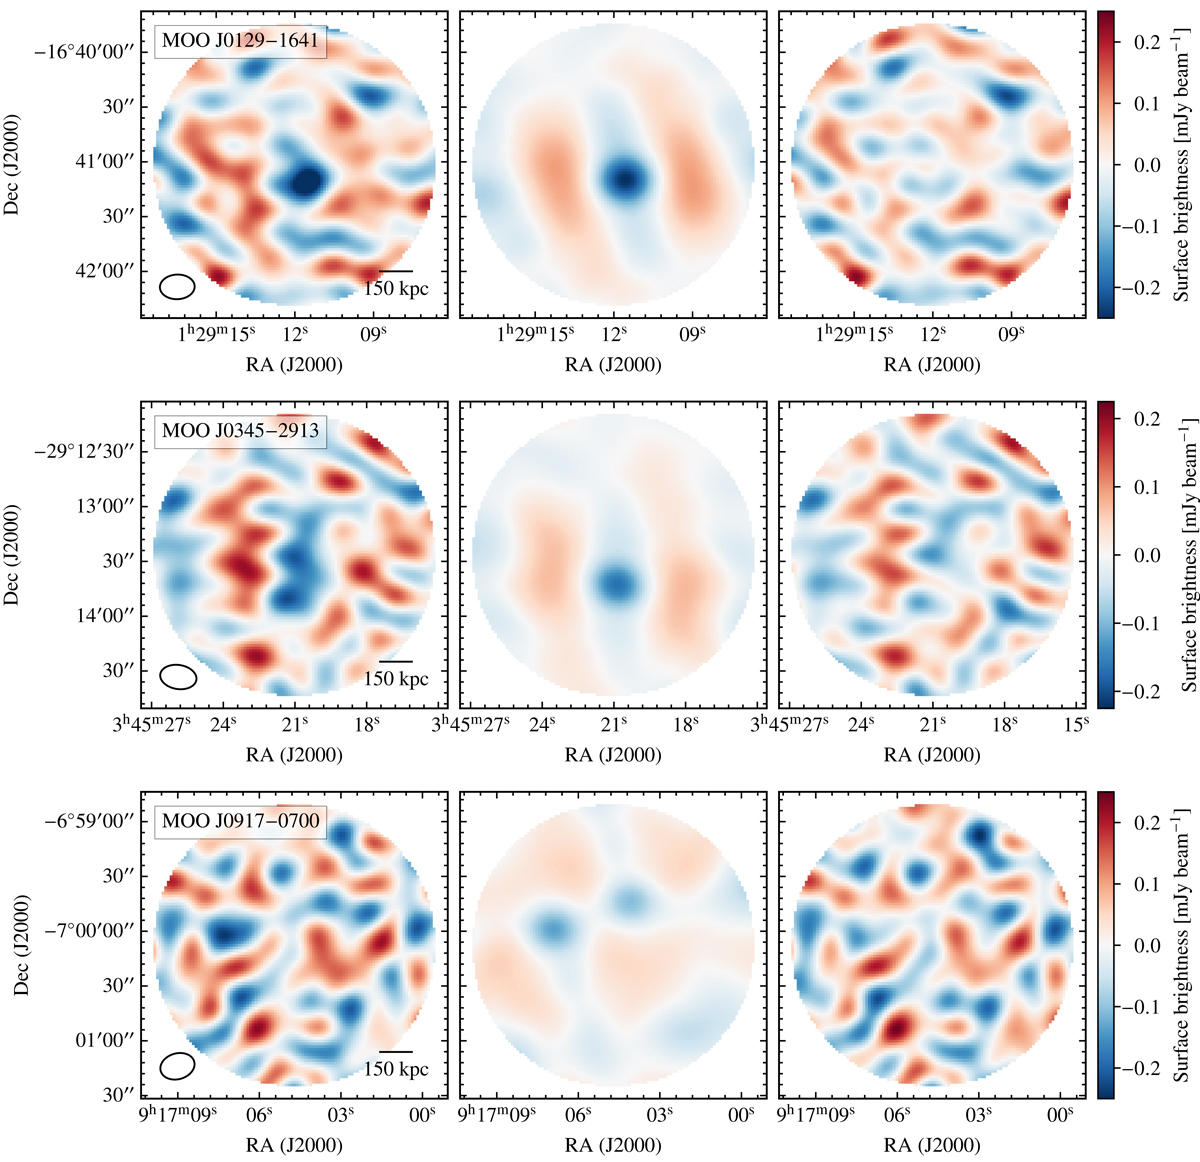
Dirty images of the raw (left), model (center), and residual (right) data of VACA LoCA observations. All the images are generated by applying a multi-frequency naturally weighted, imaging scheme, and extend out to where the ACA primary beam reaches 20% of its peak amplitude. To better highlight the SZ features in each field a 10 kλ taper is applied, but without correction for the primary beam attenuation. Furthermore, as in Fig. 3, the most significant point-like sources from the raw interferometric data are removed.
Current usage metrics show cumulative count of Article Views (full-text article views including HTML views, PDF and ePub downloads, according to the available data) and Abstracts Views on Vision4Press platform.
Data correspond to usage on the plateform after 2015. The current usage metrics is available 48-96 hours after online publication and is updated daily on week days.
Initial download of the metrics may take a while.