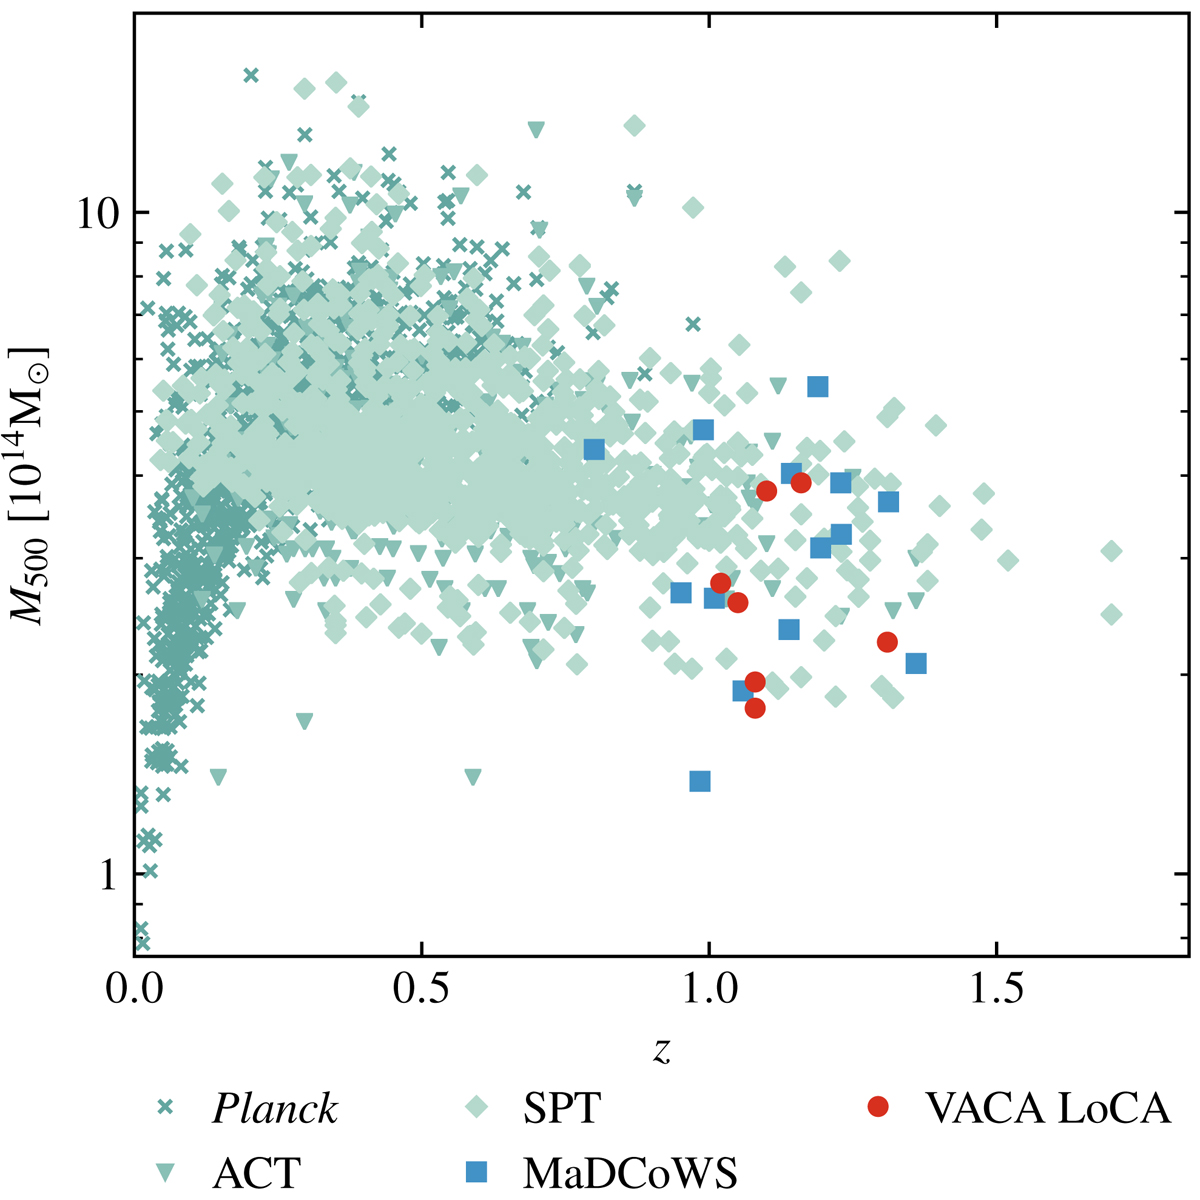
Fig. 11.

Mass vs. redshift distribution of galaxy clusters in the VACA LoCA pilot sample (red circles). The red points denote the VACA LoCA clusters with significant detections. For comparison, we include the mass estimates of previously reported MaDCoWS clusters (blue squares; Gonzalez et al. 2019) and the samples from the SZ surveys of Planck (green crosses; Planck Collaboration XXVII 2016), ACT (green triangles; Marriage et al. 2011; Hasselfield et al. 2013; Hilton et al. 2018), and SPT (green diamonds; Bocquet et al. 2019; Huang et al. 2020; Bleem et al. 2020). All the MaDCoWS clusters with SZ data are found to be comparable in mass with the clusters detected by these surveys over the same range of redshifts.
Current usage metrics show cumulative count of Article Views (full-text article views including HTML views, PDF and ePub downloads, according to the available data) and Abstracts Views on Vision4Press platform.
Data correspond to usage on the plateform after 2015. The current usage metrics is available 48-96 hours after online publication and is updated daily on week days.
Initial download of the metrics may take a while.


