Fig. 10.
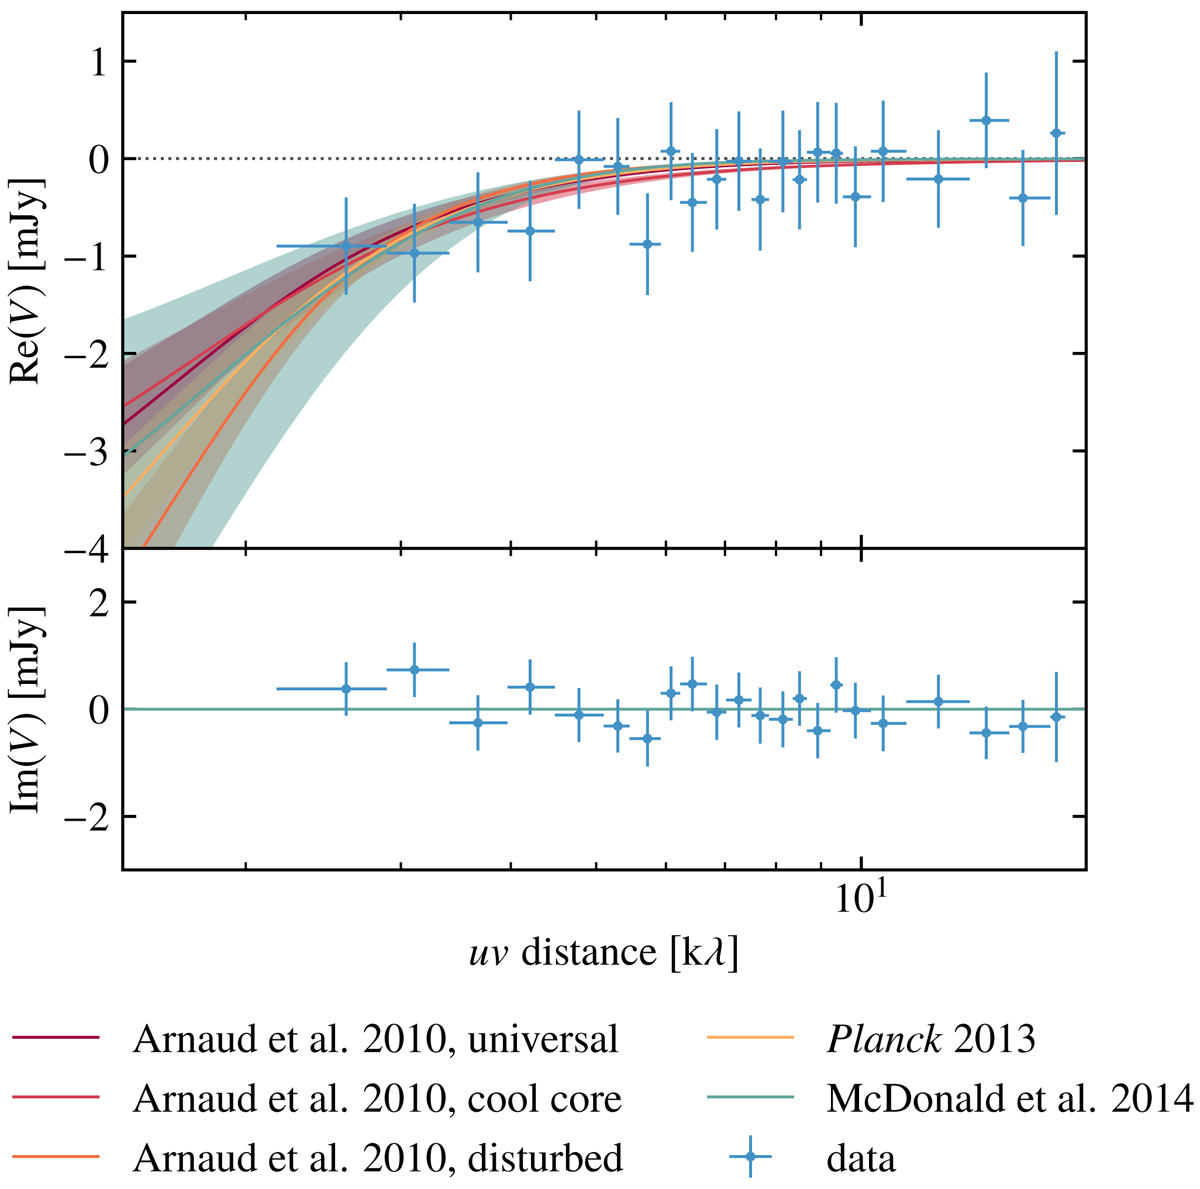
Comparison of the real (top) and imaginary (bottom) parts of ACA point source-subtracted visibilities V = V(u, v) for MOO J0129−1640, the most significant detection, and the uv radial profiles for the different flavors of gNFW (Table 2). The data are binned so that each bin contains the same number of visibilities (here set to 2500 for plotting purposes). Before averaging, we shifted the phase center to the position of the cluster centroid to minimize the ringing effect due to non-zero phases. As a result, the imaginary part of the visibilities are overall consistent with zero. Any significant deviations would be symptomatic of residual off-center point-like sources or asymmetries in the cluster SZ signal that are unaccounted for in the analysis, for example.
Current usage metrics show cumulative count of Article Views (full-text article views including HTML views, PDF and ePub downloads, according to the available data) and Abstracts Views on Vision4Press platform.
Data correspond to usage on the plateform after 2015. The current usage metrics is available 48-96 hours after online publication and is updated daily on week days.
Initial download of the metrics may take a while.