Fig. 1.
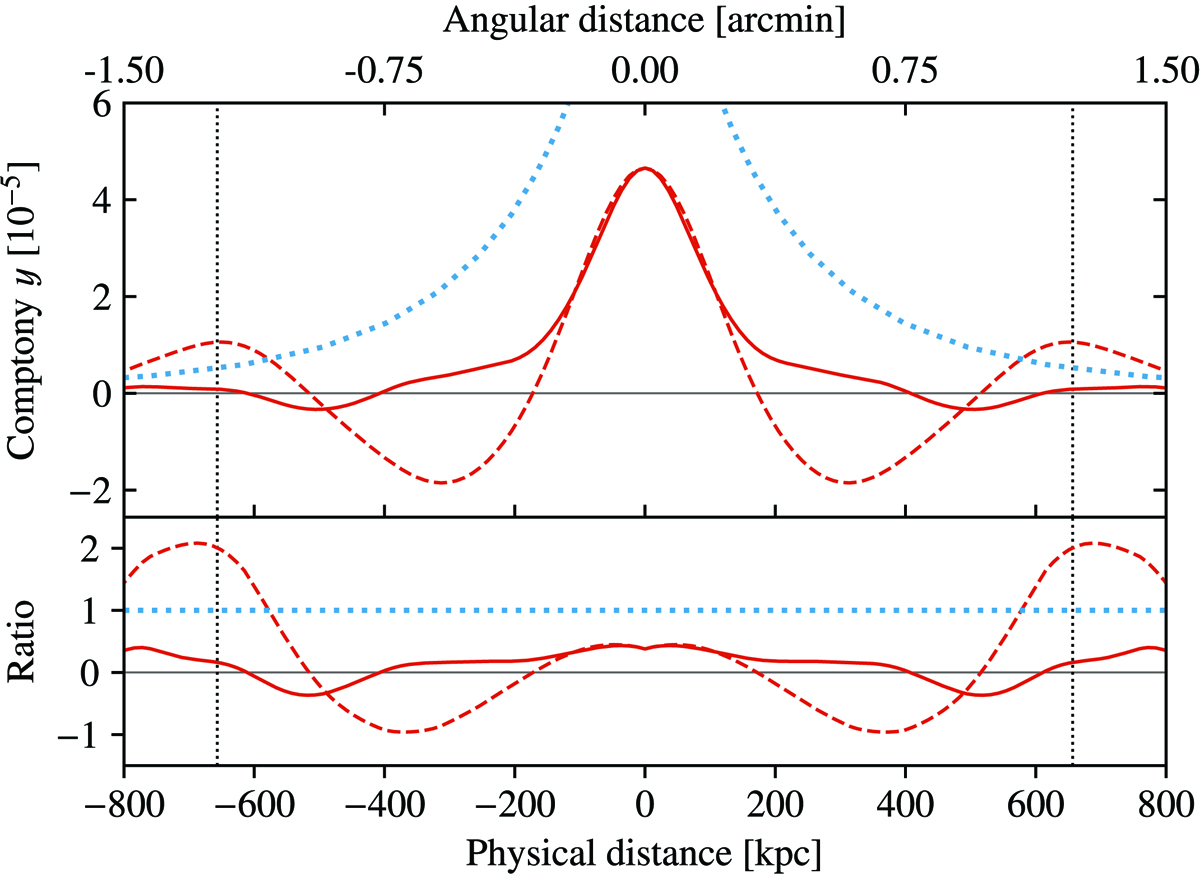
Simulated SZ profile for a cluster with mass of 2.5 × 10¹⁴ M⊙ and redshift z = 1.00, analogous to the MaDCoWS targets previously reported in Gonzalez et al. (2019). Top panel: comparison of the input SZ model (i.e., the true profile; dotted blue line), and the corresponding profiles after application of the interferometric transfer function (i.e., the filtered, observed profiles; red lines). These clearly show how the fraction of missing flux is significant already well within the r500 of the simulated cluster (see Sect. 3.1 for a definition; vertical lines). The two filtered profiles are measured along directions at constant right ascension or declination (respectively dashed and solid lines). Their difference reflects the asymmetry in the uv coverage. Lower panel: ratio of the filtered and raw profiles. The line style is the same as the upper panel, corresponding to the ratio of the filtered (observed) profiles to the unfiltered (true) profile. The blue dotted line indicates unity (i.e., no filtering).
Current usage metrics show cumulative count of Article Views (full-text article views including HTML views, PDF and ePub downloads, according to the available data) and Abstracts Views on Vision4Press platform.
Data correspond to usage on the plateform after 2015. The current usage metrics is available 48-96 hours after online publication and is updated daily on week days.
Initial download of the metrics may take a while.