Fig. 2.
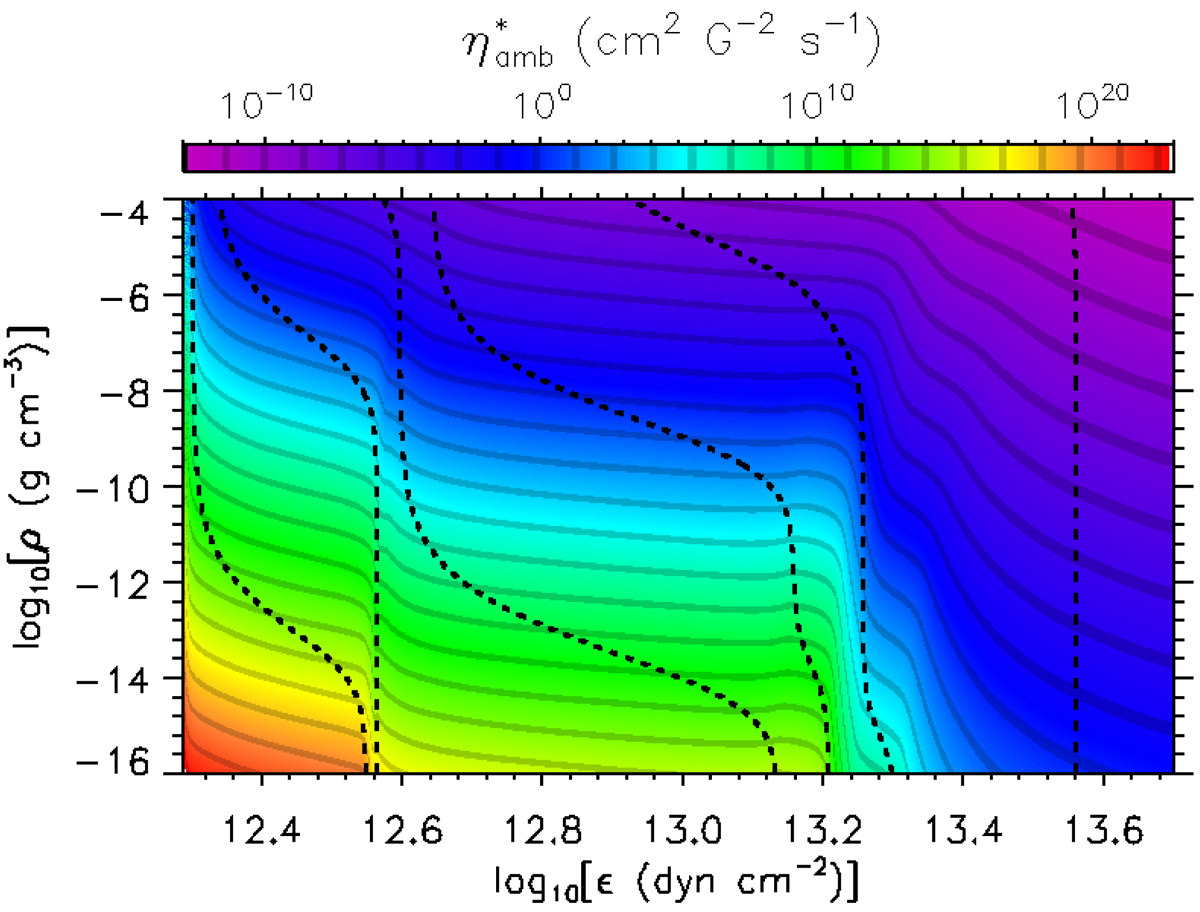
Tabulated ![]() as a function of density, ρ, and internal energy per unit volume, ϵ. The values for ϵ are shifted by 5 eV to obtain a positive internal energy when having hydrogen molecules (see main text). Temperature isocontours are superimposed as dashed lines for (from left to right) 3 × 10³ K, 6 × 10³ K, 104 K, 2 × 10⁴ K, and 105 K.
as a function of density, ρ, and internal energy per unit volume, ϵ. The values for ϵ are shifted by 5 eV to obtain a positive internal energy when having hydrogen molecules (see main text). Temperature isocontours are superimposed as dashed lines for (from left to right) 3 × 10³ K, 6 × 10³ K, 104 K, 2 × 10⁴ K, and 105 K.
Current usage metrics show cumulative count of Article Views (full-text article views including HTML views, PDF and ePub downloads, according to the available data) and Abstracts Views on Vision4Press platform.
Data correspond to usage on the plateform after 2015. The current usage metrics is available 48-96 hours after online publication and is updated daily on week days.
Initial download of the metrics may take a while.