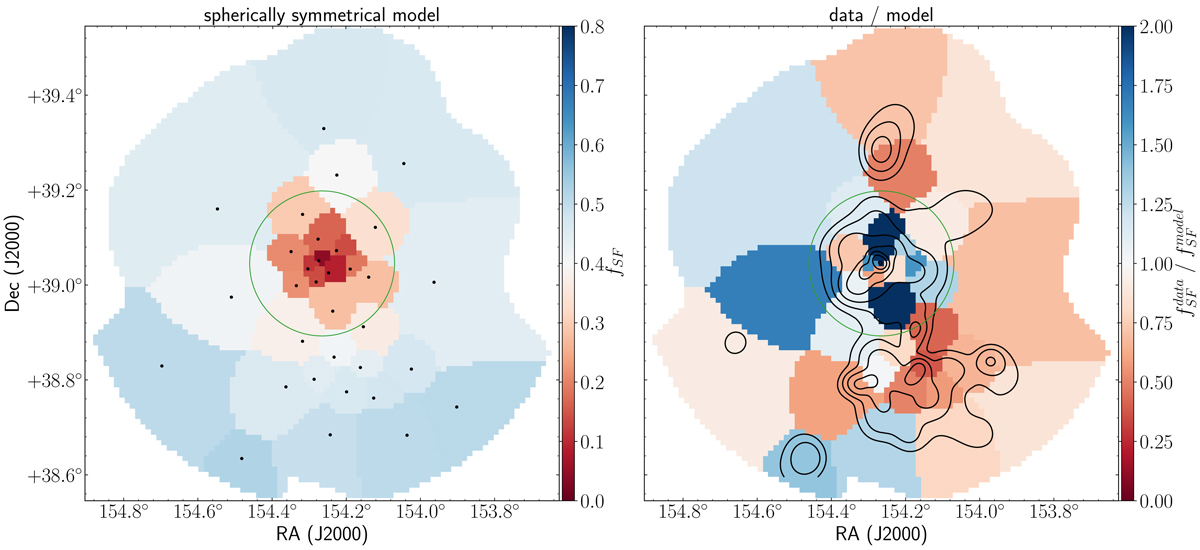
Fig. 9.

Left: model from Fig. 8, which minimises the difference with the binned data, with a delay of 2.17 Gyr, converted to 2D distribution and used to populate the Voronoi bins with star forming galaxies, according to their K-band luminosity weighted centroids (black points). Right: map of fSF, shown in Fig. 7, divided by the spherically symmetrical model shown on the left. Blue bins show an excess of star forming galaxies, red ones show a lack. The black contours show the K-band luminosity density. The lowest contour is at 40 K⋆ Mpc−2. Each following contour is at twice the level of the previous one. The green circle has a radius equal to R200 of the cluster.
Current usage metrics show cumulative count of Article Views (full-text article views including HTML views, PDF and ePub downloads, according to the available data) and Abstracts Views on Vision4Press platform.
Data correspond to usage on the plateform after 2015. The current usage metrics is available 48-96 hours after online publication and is updated daily on week days.
Initial download of the metrics may take a while.


