Fig. 8.
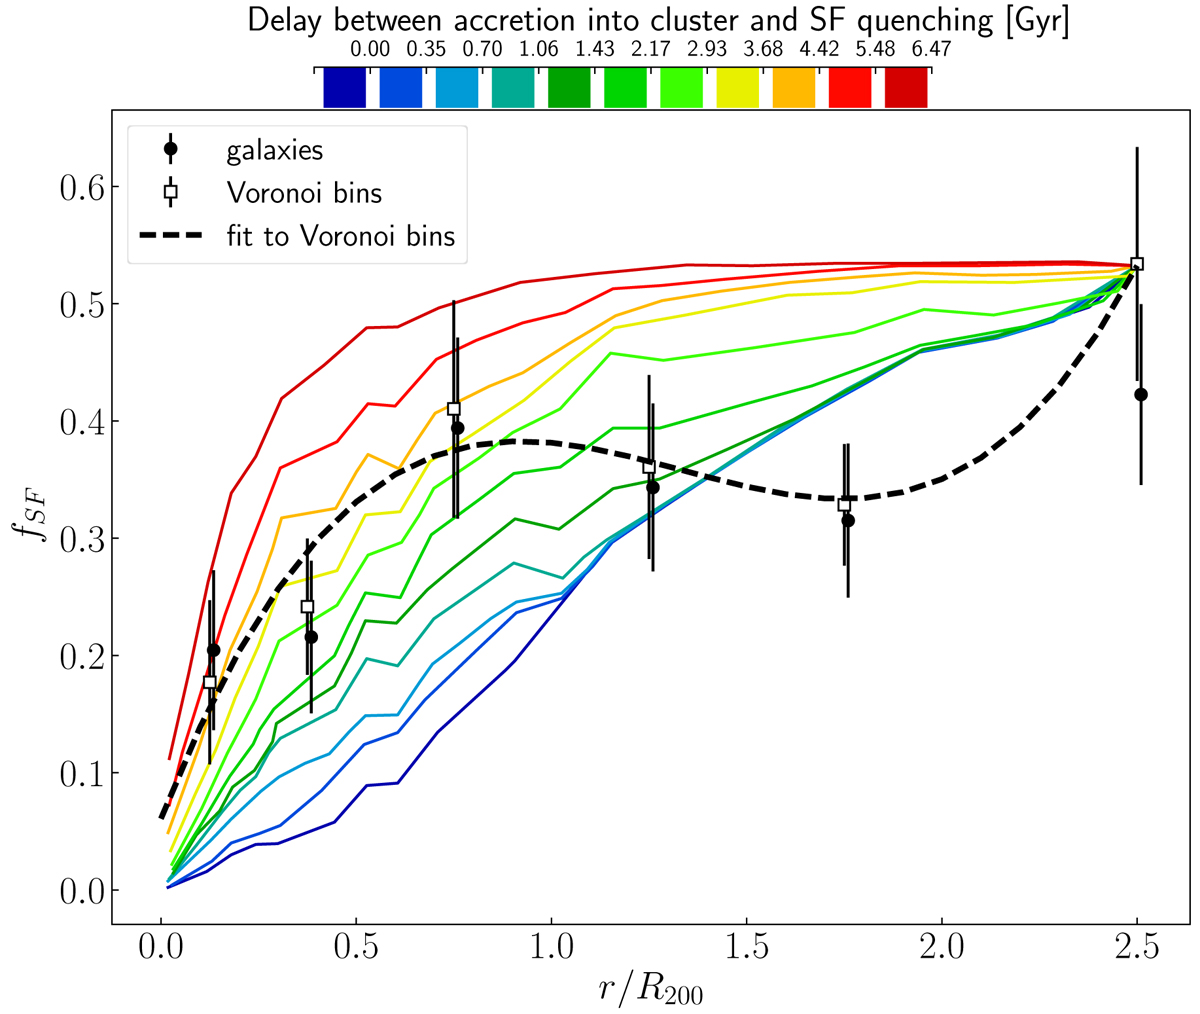
Fraction of star forming galaxies as a function of cluster-centric distance in simulated clusters and in A963. Thin lines of different colour represent galaxies quenched with a delay after their crossing of R200 of the parent cluster, according to the colour bar at the top of the figure. The data for A963 are shown in black (symbols and line). The fSF values calculated for individual galaxies are shown as black points, and the mean fSF values within each Voronoi bin are shown as empty squares. The dashed line shows a third-order polynomial fit to the Voronoi bins. For clarity, a small horizontal offset has been added to the black points.
Current usage metrics show cumulative count of Article Views (full-text article views including HTML views, PDF and ePub downloads, according to the available data) and Abstracts Views on Vision4Press platform.
Data correspond to usage on the plateform after 2015. The current usage metrics is available 48-96 hours after online publication and is updated daily on week days.
Initial download of the metrics may take a while.