Fig. 5.
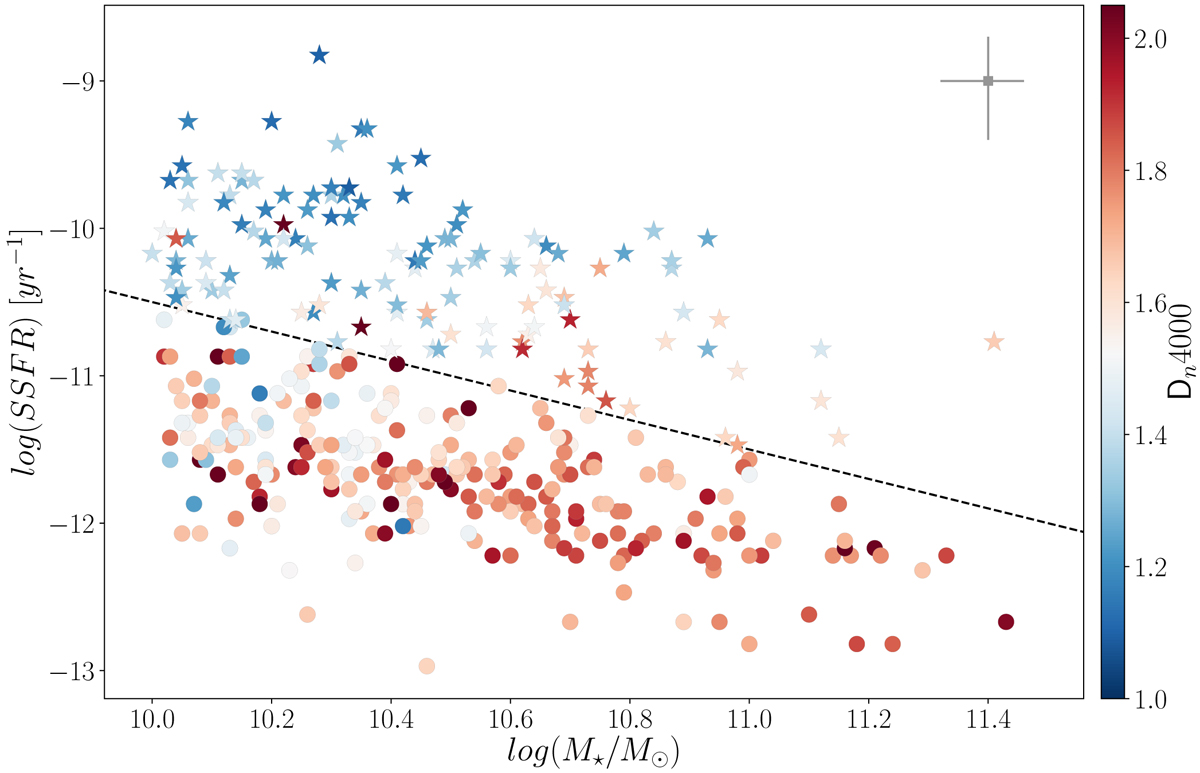
Specific star formation rate of the A963 member galaxies as a function of their stellar mass. The black, dashed line at constant log(SFR) = −0.5 is used to split the galaxies into star forming, shown with stars, and passive, shown with circles. Symbols are coloured according to the strength of the 4000 Å drop in luminosity. The symbol in the upper right corner shows median uncertainties.
Current usage metrics show cumulative count of Article Views (full-text article views including HTML views, PDF and ePub downloads, according to the available data) and Abstracts Views on Vision4Press platform.
Data correspond to usage on the plateform after 2015. The current usage metrics is available 48-96 hours after online publication and is updated daily on week days.
Initial download of the metrics may take a while.