Fig. 4.
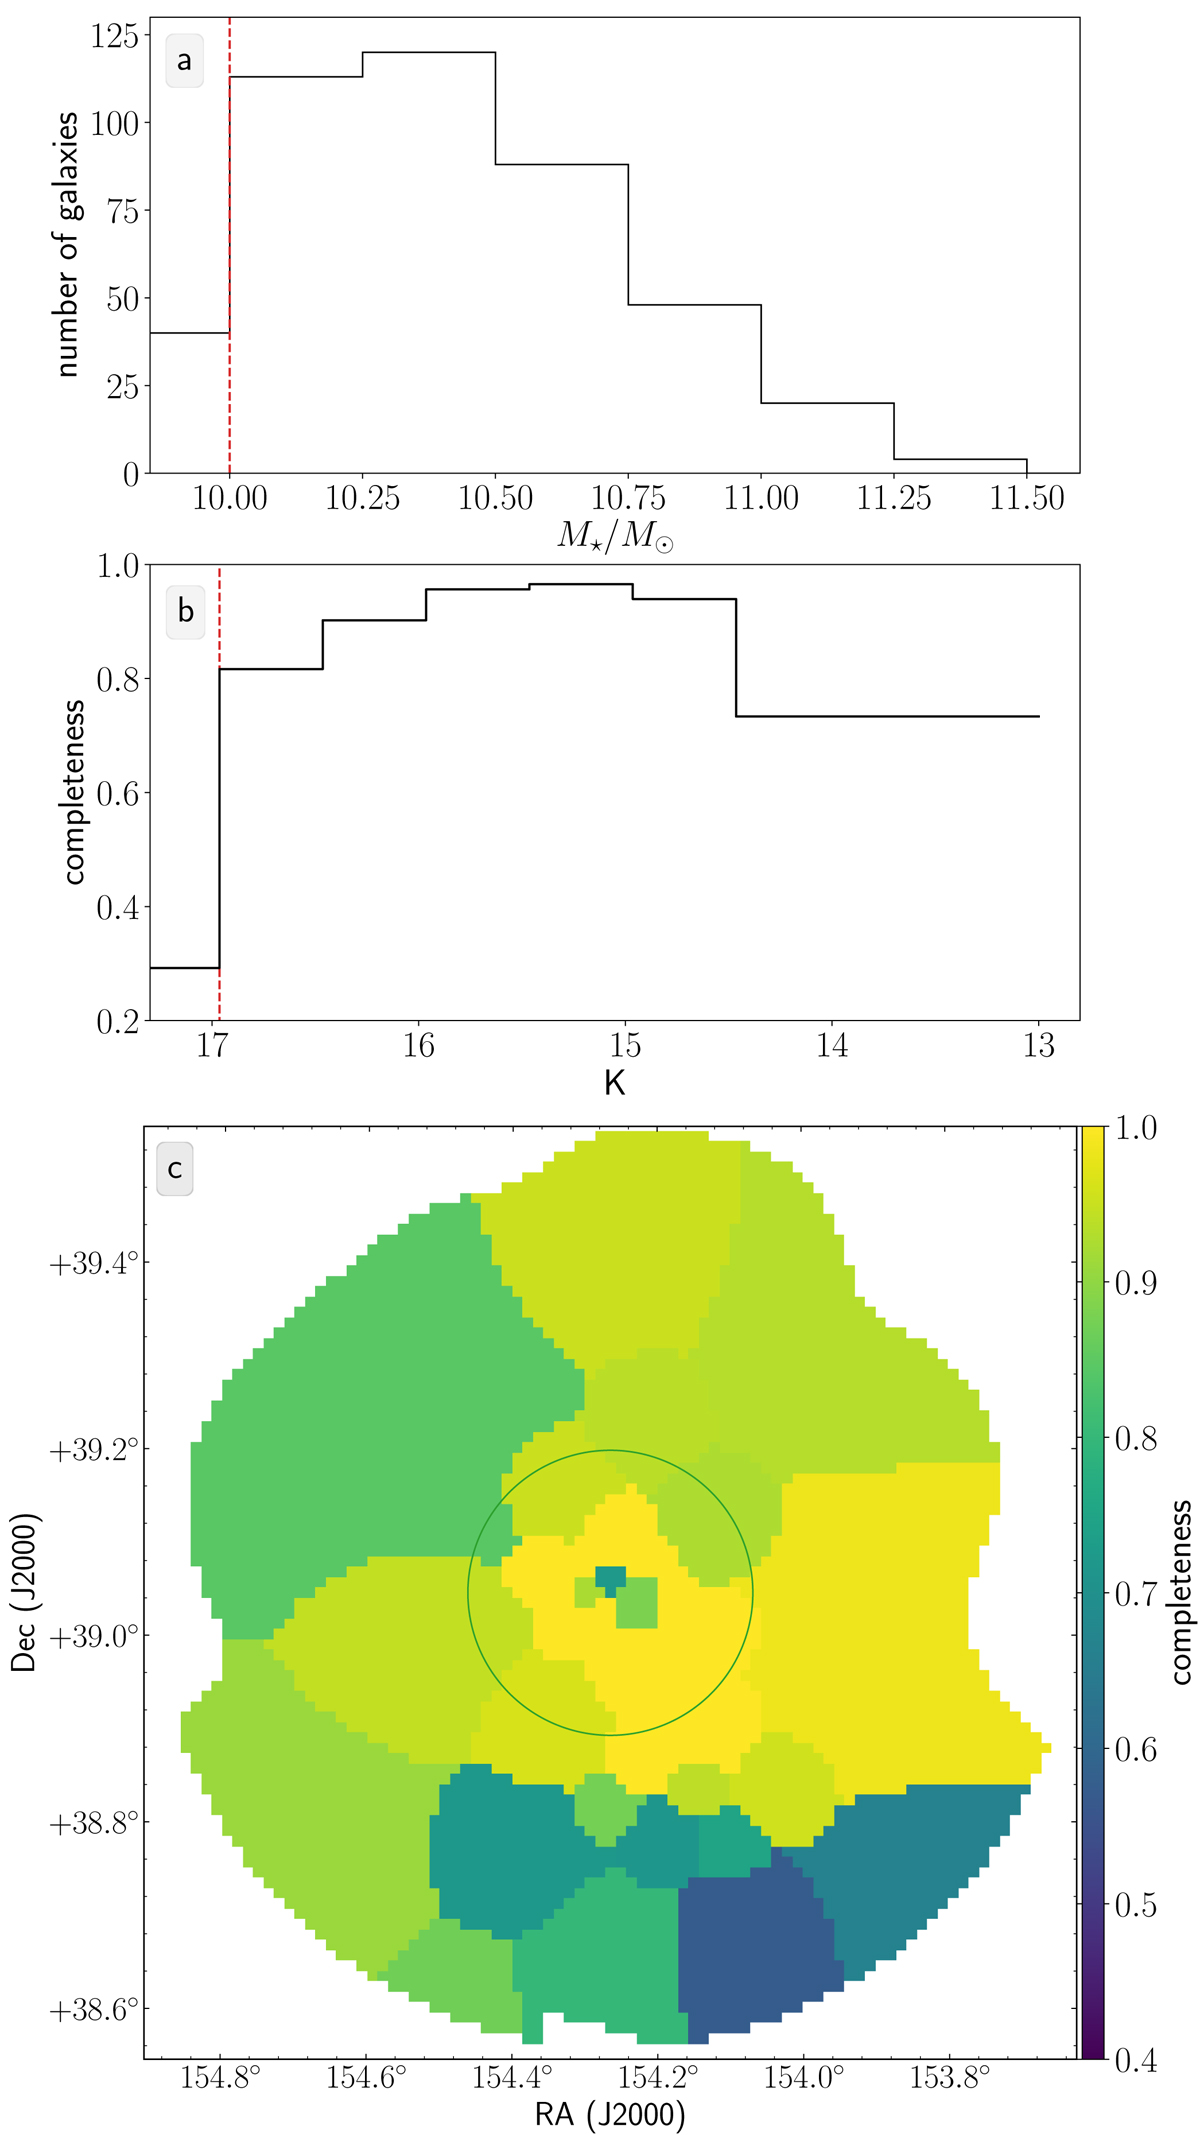
Panel a: stellar mass distribution of the cluster members with the completeness limit indicated by the red, dashed line. Panel b: completeness of our data set with respect to K-band luminosity. The red dashed line is at K = K⋆+2.0- the magnitude limit of ACReS survey. Panel c: completeness distribution on the sky. The green circle has a radius equal to R200 of the cluster.
Current usage metrics show cumulative count of Article Views (full-text article views including HTML views, PDF and ePub downloads, according to the available data) and Abstracts Views on Vision4Press platform.
Data correspond to usage on the plateform after 2015. The current usage metrics is available 48-96 hours after online publication and is updated daily on week days.
Initial download of the metrics may take a while.