Fig. 15.
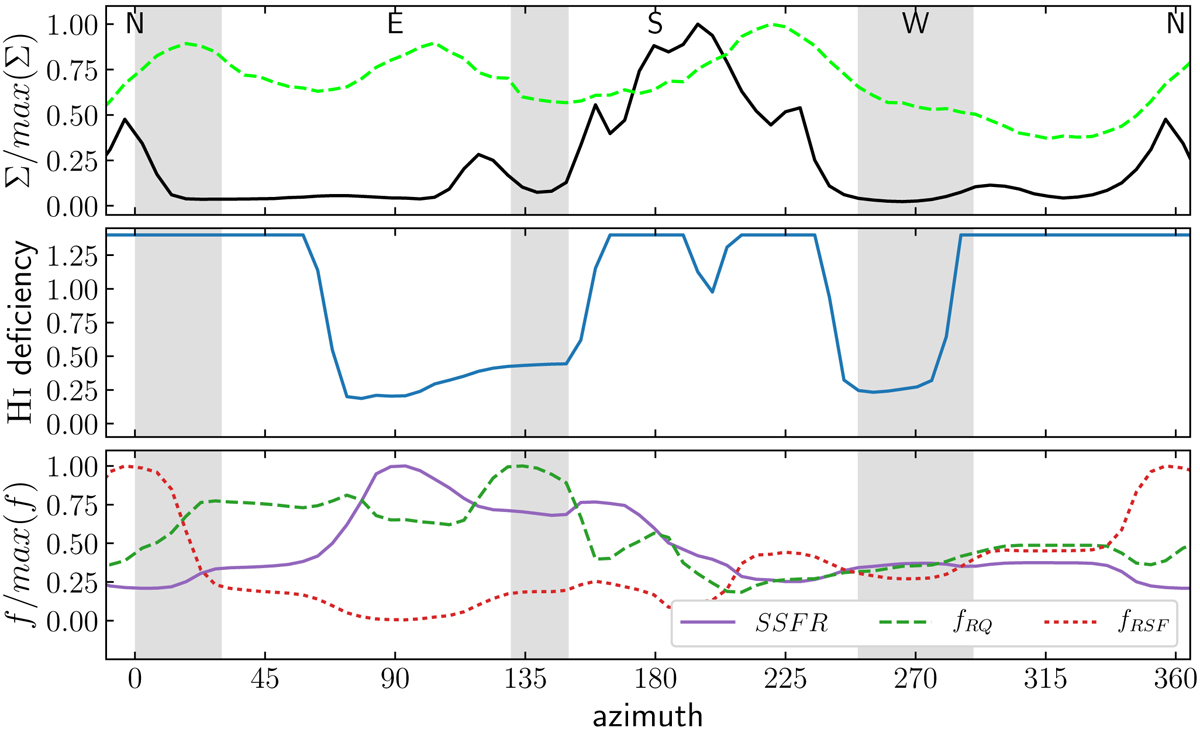
Properties of the galaxy population in the vicinity of A963 and its infall region as a function of the azimuthal angle. Top panel: galaxy number density normalised to its maximum. The black curve shows the average K-band luminosity density in the infall region (between 1.5 R200 and the edge of the field at ≲3 R200). The lime green dashed line shows the mean galaxy number density between 10 and 20 R200. Middle panel: H I deficiency in the infall region. Bottom panel: specific star formation rate (solid purple line), fraction of RQ (dashed green line), and fraction of RSF (red dotted line), expressed as a fraction of their maximum. The grey shaded areas represent the location and relative angular span of the three filaments suggested by J16.
Current usage metrics show cumulative count of Article Views (full-text article views including HTML views, PDF and ePub downloads, according to the available data) and Abstracts Views on Vision4Press platform.
Data correspond to usage on the plateform after 2015. The current usage metrics is available 48-96 hours after online publication and is updated daily on week days.
Initial download of the metrics may take a while.