Fig. 13.
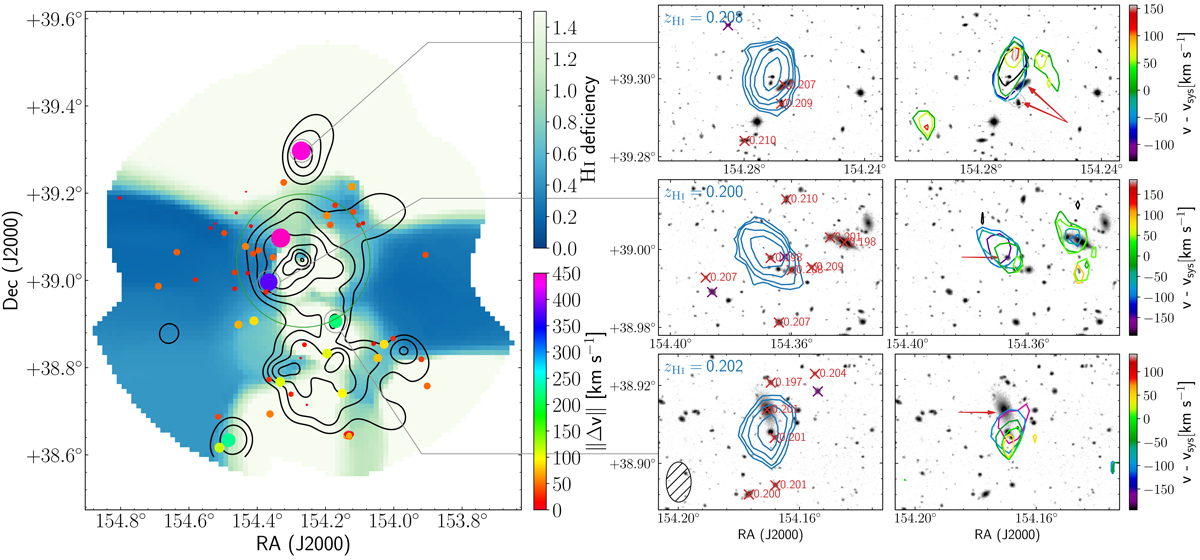
Left: map of the local H I deficiency of star forming galaxies. Lighter colours indicate high deficiency. This is derived from all star forming galaxies. Overlaid are symbols indicating the location of galaxies that are individually detected at 21 cm. The sizes and colours of the symbols are proportional to the offset between the systemic velocities of the gaseous and stellar components. The black contours show the K-band luminosity density, as in Fig. 9. The green circle has a radius equal to R200 of the cluster. Middle: total H I maps of three selected sources overplotted on the R-band image. The contours are drawn at 20, 40, 80, 160, and 320 μJy beam−1. The cluster members with optical spectroscopy are shown in red, and their redshift is indicated. The non-member galaxies with optical spectroscopy are shown in purple. The central redshift of the H I signal is indicated in the top left corner. The beam size is shown in the lowest panel. Right: renzograms of the selected sources. Contours at a constant significance level of 3σ are drawn for every channel containing signal from the source. The noise is estimated from the surrounding area of the sources as a function of frequency. The difference between the central velocity of the channels and the central velocity of the entire H I signal is colour-coded. The proposed optical counterparts are indicated with red arrows.
Current usage metrics show cumulative count of Article Views (full-text article views including HTML views, PDF and ePub downloads, according to the available data) and Abstracts Views on Vision4Press platform.
Data correspond to usage on the plateform after 2015. The current usage metrics is available 48-96 hours after online publication and is updated daily on week days.
Initial download of the metrics may take a while.