Fig. 1.
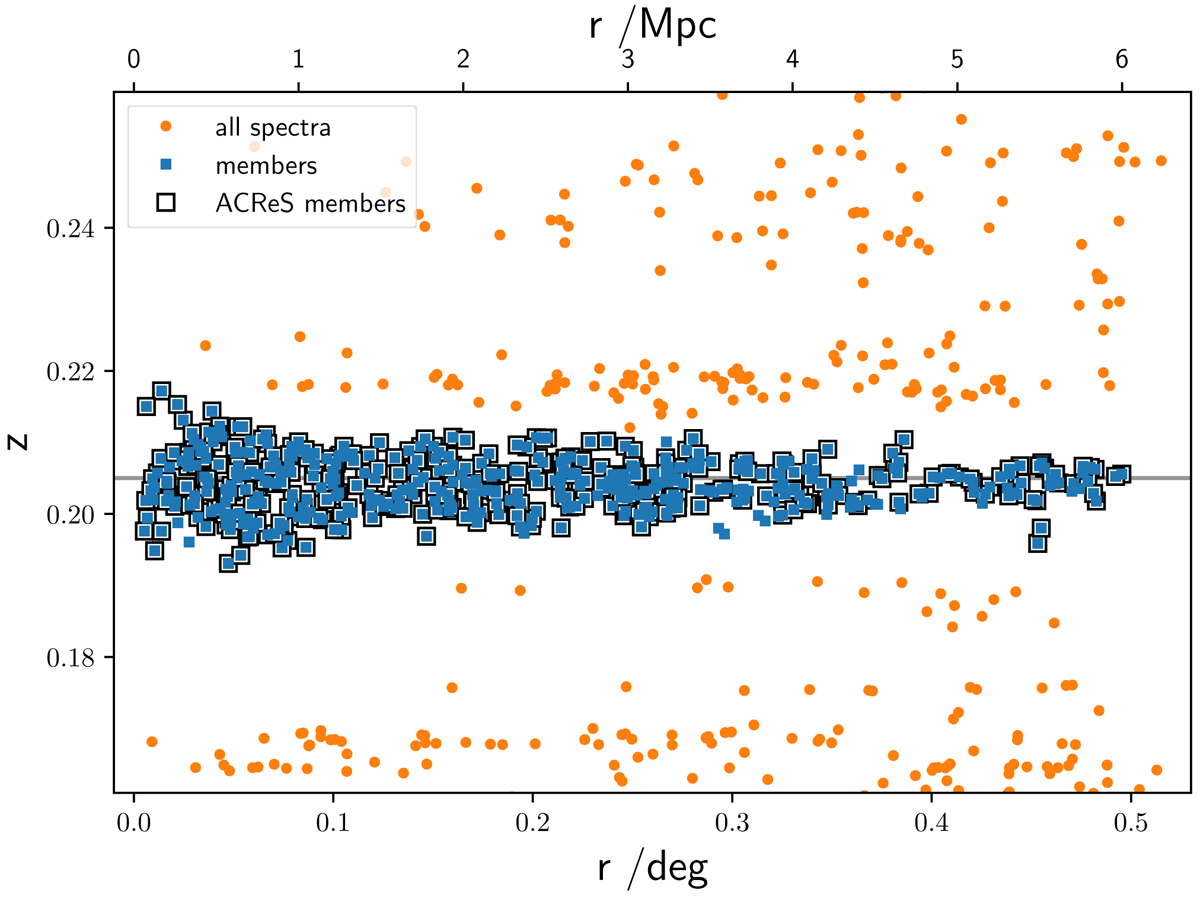
Selection of the cluster members (blue squares) of A963 in projected phase space, redshift vs. cluster-centric distance. The cluster members from the ACReS survey have black squares around their symbols. The orange dots show all the galaxies with spectroscopy in the field. The redshift of the cluster (z = 0.205) is shown with the grey horizontal line.
Current usage metrics show cumulative count of Article Views (full-text article views including HTML views, PDF and ePub downloads, according to the available data) and Abstracts Views on Vision4Press platform.
Data correspond to usage on the plateform after 2015. The current usage metrics is available 48-96 hours after online publication and is updated daily on week days.
Initial download of the metrics may take a while.