Fig. 5.
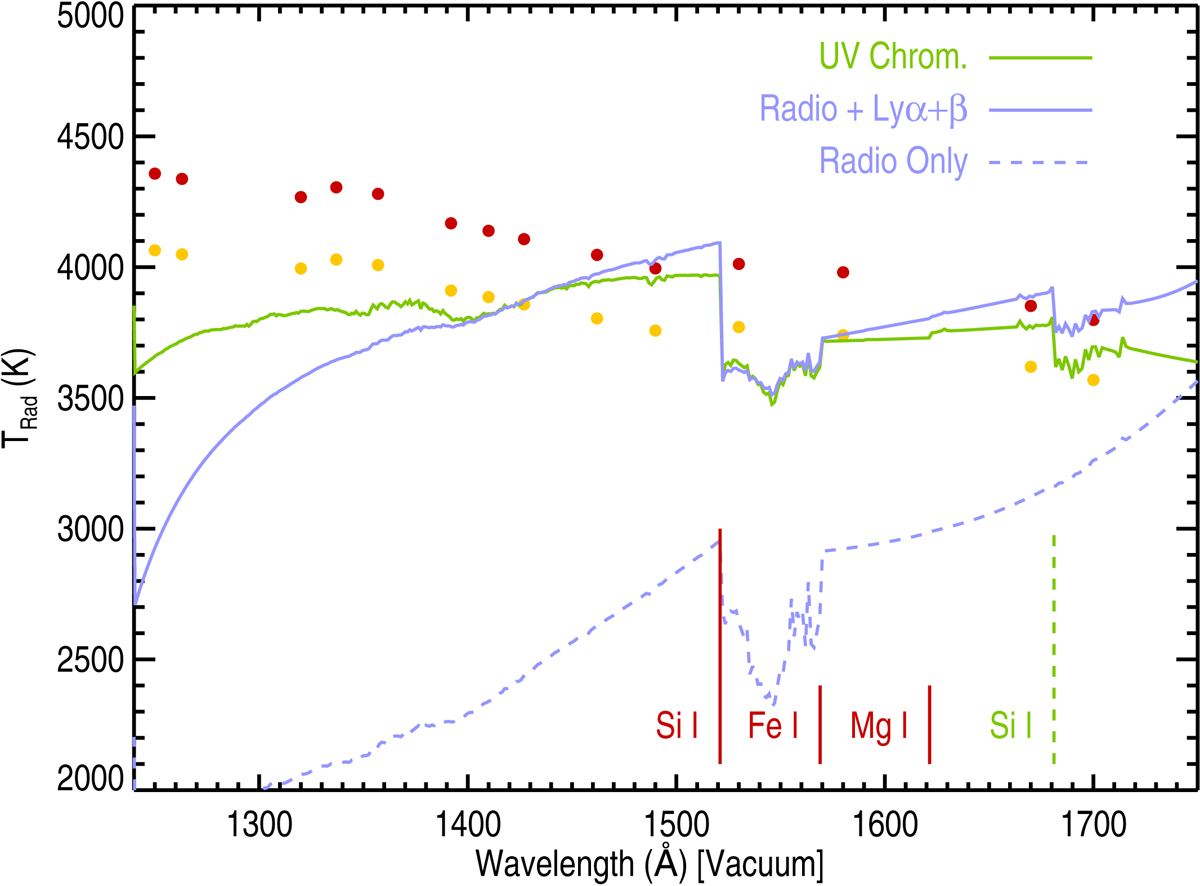
Observed and simulated radiation temperatures for the FUV spectrum of Betelgeuse. The observed continuum values are shown as solid circles: yellow for no ISM reddening, and red for an extinction of AV = 0.62 (see text for details). The blue lines are simulations based on an empirically derived temperature profile of the extended atmosphere of Betelgeuse. The dashed line is the line predicted in the absence of any additional sources of excitation. Si is partially ionized, and there is sufficient opacity for the ground-state edge to be optically thick in the cooler outer layers, leading to very low fluxes λ < 1680 Å. Adding photoionization from H I Lyα and Lyβ increases the ionization to the point where the optical depth unity surface is near the thermal peak at 2R⋆. The solid green line is the line from the compact hot chromospheric model of Basri et al. (1981). The hydrogen ionization from the hot chromospheric plasma leads to additional emission at shorter wavelengths. The solid vertical red lines indicate the location of the ground-state photoionization edges, and the dashed green line is the photoionization edge form the first excited Si I term. The Si I edges are intrinsically stronger than those of Fe I and Mg I.
Current usage metrics show cumulative count of Article Views (full-text article views including HTML views, PDF and ePub downloads, according to the available data) and Abstracts Views on Vision4Press platform.
Data correspond to usage on the plateform after 2015. The current usage metrics is available 48-96 hours after online publication and is updated daily on week days.
Initial download of the metrics may take a while.