Fig. 4.
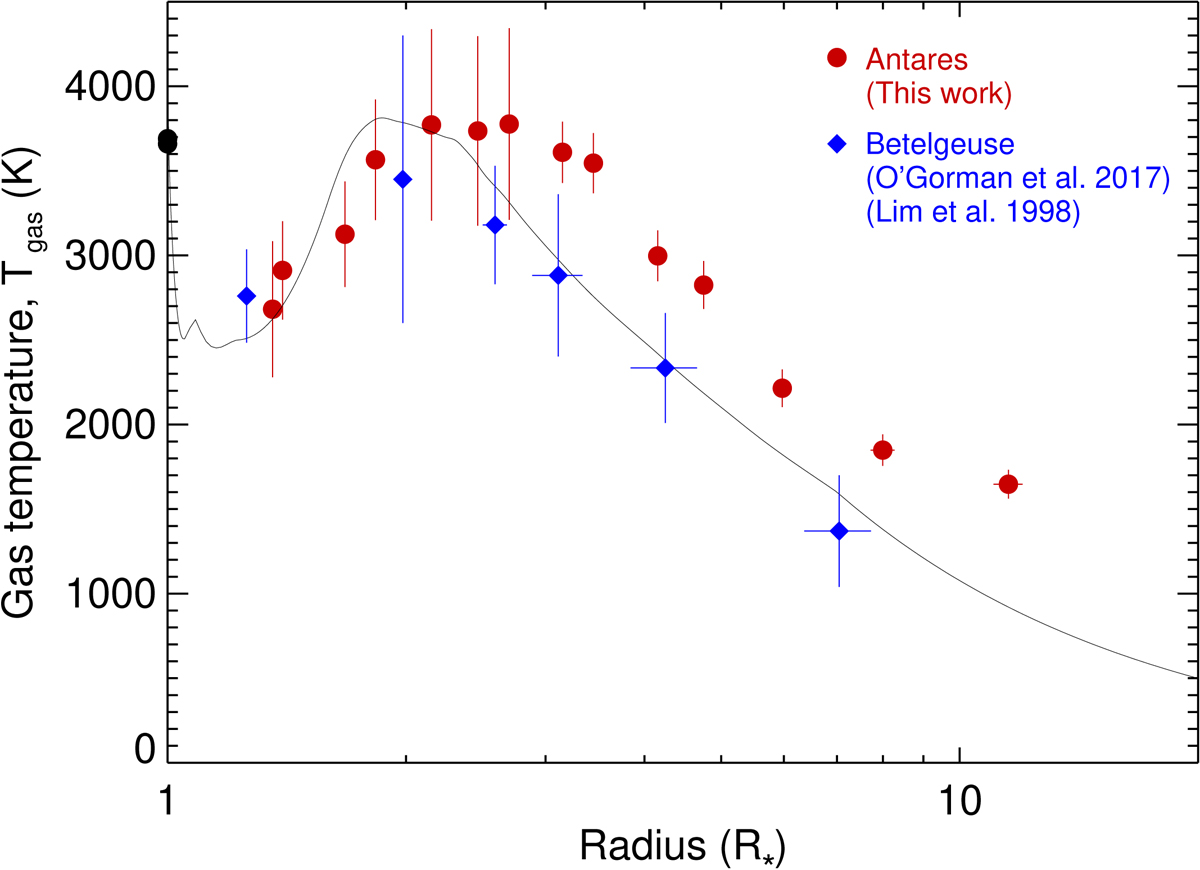
Comparison of the temperature structure of the extended atmospheres of the early-M supergiants Antares and Betelgeuse. The filled red circles are the measurements summarized in this work for Antares, and the filled blue diamonds are the measurements for Betelgeuse (Lim et al. 1998; O’Gorman et al. 2017). The error bars in the gas temperature include the uncertainty in absolute flux density scale. The overlapping filled black circles at R⋆ = 1 represent the photospheric effective temperatures of Antares and Betelgeuse. The solid black line is the temperature profile of the semiempirical model for the extended atmosphere of Betelgeuse discussed in Sect. 4.2 and Appendix B.
Current usage metrics show cumulative count of Article Views (full-text article views including HTML views, PDF and ePub downloads, according to the available data) and Abstracts Views on Vision4Press platform.
Data correspond to usage on the plateform after 2015. The current usage metrics is available 48-96 hours after online publication and is updated daily on week days.
Initial download of the metrics may take a while.