Fig. 2.
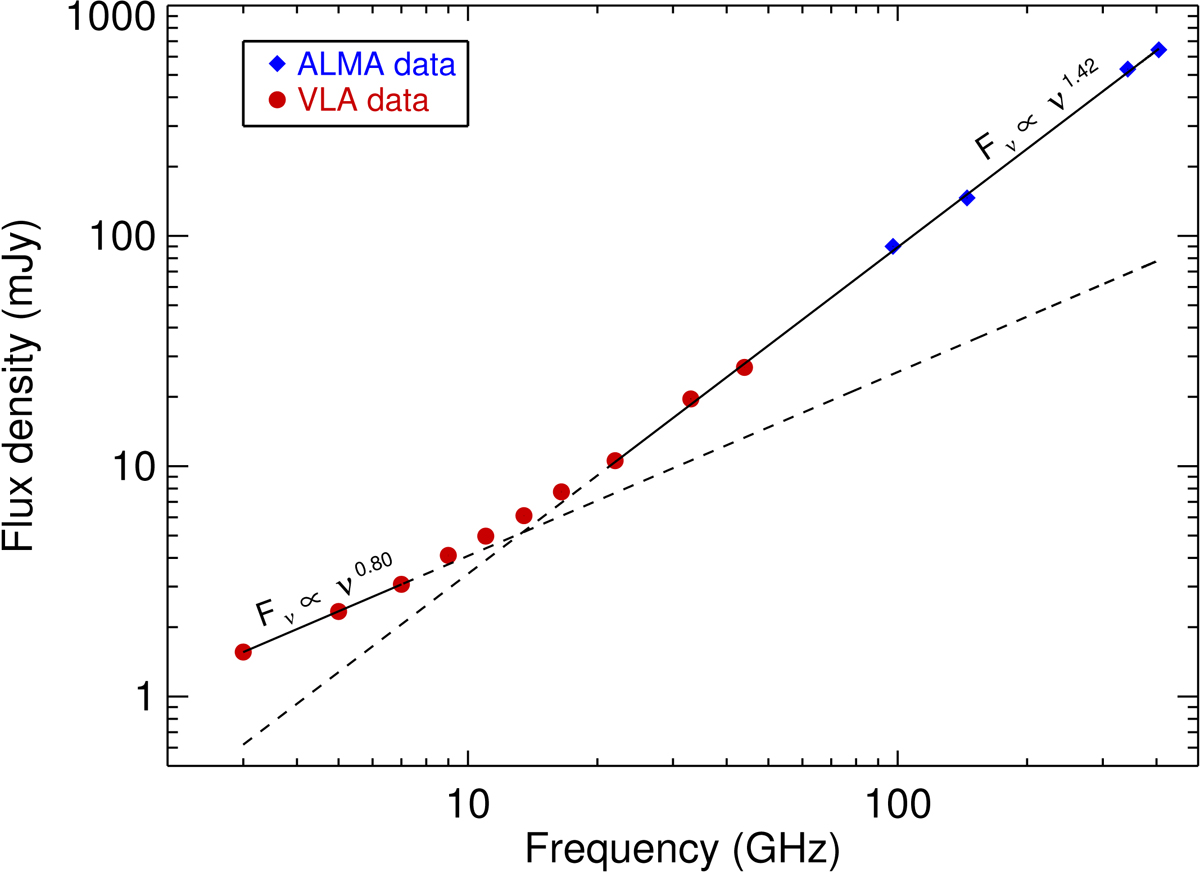
Radio spectral energy distribution for the red supergiant Antares. The filled red circles and the filled blue diamonds represent the VLA and ALMA data, respectively, and include the statistical 1σ error bars. The continuous lines represents the best-fit line to the underlying data points, while the dashed lines are extrapolations to the remaining data points. The slope on the lines (i.e., the spectral index values) clearly changes from 1.42 above 20 GHz to 0.80 below 8 GHz.
Current usage metrics show cumulative count of Article Views (full-text article views including HTML views, PDF and ePub downloads, according to the available data) and Abstracts Views on Vision4Press platform.
Data correspond to usage on the plateform after 2015. The current usage metrics is available 48-96 hours after online publication and is updated daily on week days.
Initial download of the metrics may take a while.