Free Access
Fig. 4.
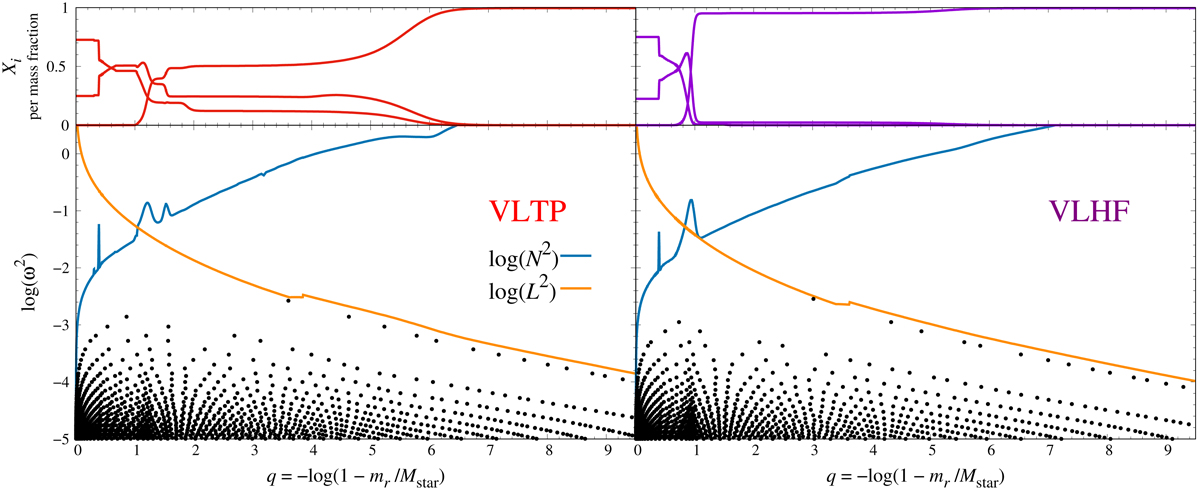
Lamb and Brunt-Väisälä frequencies (lower panels) and the chemical profile (upper panels) for the same models shown in Fig. 3. In the lower panels, the black dots indicate the location of the nodes (zero displacement) of the radial eigenfunctions of g modes.
Current usage metrics show cumulative count of Article Views (full-text article views including HTML views, PDF and ePub downloads, according to the available data) and Abstracts Views on Vision4Press platform.
Data correspond to usage on the plateform after 2015. The current usage metrics is available 48-96 hours after online publication and is updated daily on week days.
Initial download of the metrics may take a while.