Fig. 9.
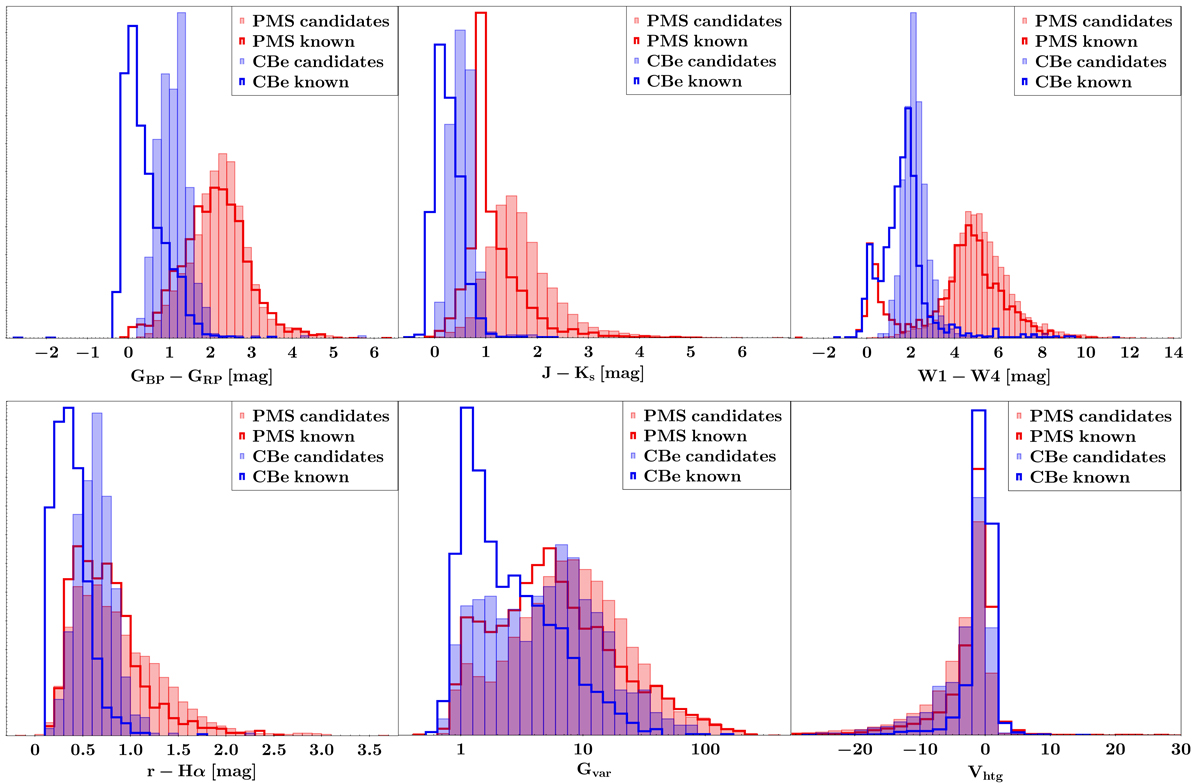
Frequency density distribution of PMS candidates in shaded red and classical Be candidates in shaded blue for different selected observables. The red and blue lines respectively trace all considered known PMS and CBe objects, including those without all the observables. Area of each histogram has been normalised to one. For clarity, some individual extreme sources are out of bounds in the r − Hα, Gvar, and Vhtg plots.
Current usage metrics show cumulative count of Article Views (full-text article views including HTML views, PDF and ePub downloads, according to the available data) and Abstracts Views on Vision4Press platform.
Data correspond to usage on the plateform after 2015. The current usage metrics is available 48-96 hours after online publication and is updated daily on week days.
Initial download of the metrics may take a while.